Previous Story
A Strategy for Silvers Next Breakout
By Walker England, Forex Trading Instructor
Talking Points:
- Silver is currently trading well under the 200MVA
- Triangles allow traders to prepare for a breakout
- Risk and reward levels can be managed using support & resistance
Silver (XAG/USD) prices have been consolidating after a continued decline during the 2014 trading year. As prices now move in a descending triangle pattern, traders wait for their next entry with the trend. Today we will review how to approach the current price pattern and plan for silvers next big breakout. Let’s get started!
Silver and the 200MVA
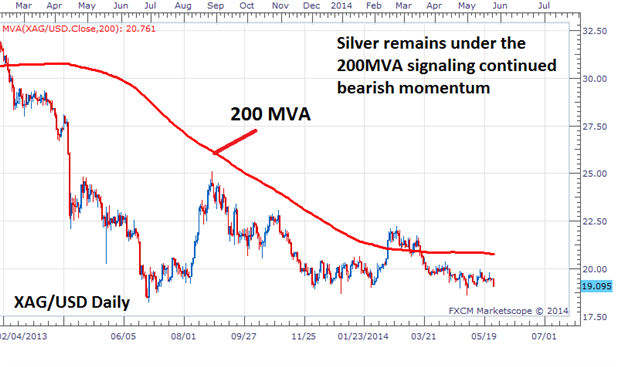
The 200 period moving average (MVA) is a simple technical tools that can be designated to help traders identify the trend. For example if prices are declining faster than the 200 period MVA and trading beneath the technical indicator, traders can interpret this as a downtrend.
This is exactly the case with silver, as displayed below on the daily chart. The metal has been trading underneath the 200 MVA now for the better part of the last fifteen months. Knowing this, traders looking to enter into the trend can wait for opportunities to sell the market.
Presented by FXCM’s Marketscope Charts
Planning for a Breakout
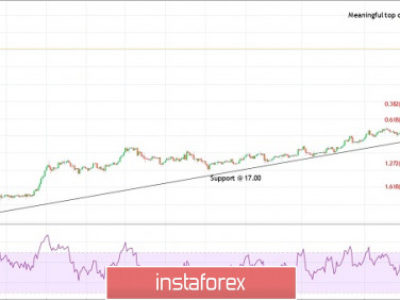
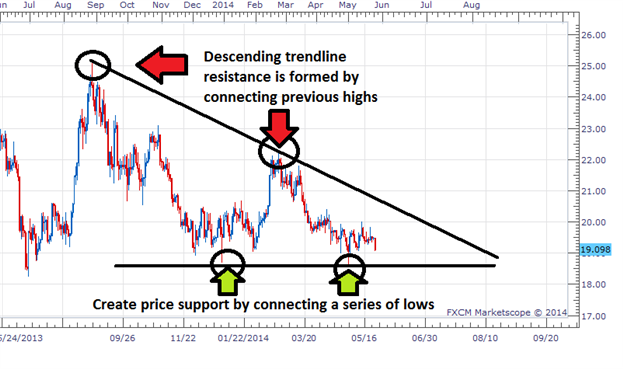
Now that we have a directional bias of the trend using the 200MVA, we can use this in conjuncture with other techniques find opportunities to sell the market. Below you will see a series of trendlines added to the silver daily chart to form a descending triangle. This price pattern is formed by first finding a series of lower highs, which can be connected to form a descending trendline. As shown below, this line has been created by connecting two previous highs on the metal.
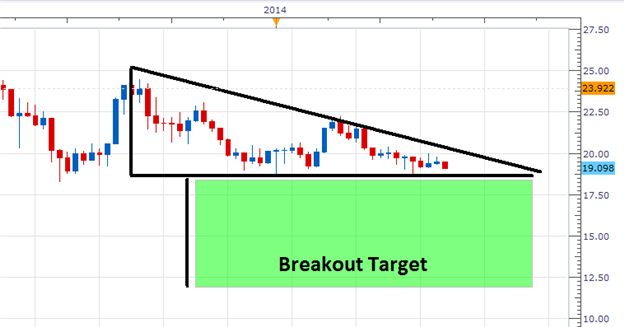
Next, trend traders will look for opportunities to sell silver as long as price for the metal continues to decline under resistance. Due to the definition of a trend, gold must create a series of lower lows in order for the current downtrend to continue. This will allow traders to first target the next value of horizontal support near $18.49. Breakout traders will wait patiently to enter the market only once this value has been breached.
Presented by FXCM’s Marketscope Charts
Managing Risk
As with any trading strategy, trading breakouts carry risk. Most risk is associated with a false breakout, and traders should be prepared for this scenario through the use of a stop order. One easy way to manage risk when trading a triangle is to place your stop between the previously identified levels of support and resistance. In the event of a breakout and price moves back inside the triangle, any existing sell positions should be exited.
Now that you are more familiar with the key price levels on silver, you can practice trading the metal on a demo account. You can get started following gold prices and your favorite currency pairs such as the EURUSD with a Free Forex Demo with FXCM. This way you can develop your trading skills while tracking the market in real time!
Presented by FXCM’s Marketscope Charts
—Written by Walker England, Trading Instructor
To contact Walker, email wengland@fxcm.com. Follow me on Twitter at @WEnglandFX.
[adrotate banner= “65”]