Previous Story
All Trading Styles are the Same

Hello traders! This week’s newsletter comes to you from stormy Dallas, Texas. If you ever want to visit, make sure it’s not during springtime! Strong storms with tornadoes and hail are pretty frequent and make outdoor activities hazardous to say the least. The actual topic of this week’s newsletter is that every trading style looks for the same thing, just on different charts.
As you may have heard by now, different traders will look at different time frames depending on how long they want to hold on to their trades; this is their trading style. A day trader may want to be in a trade for a few minutes to a few hours, a swing trader may want to be in for a few days, and a long term trader may want to be in a trade for a few weeks. The interesting thing is that they will often look for the same patterns, just on different time frame charts.
In this weekly chart of the USDJPY, we have a classic rally (uptrend) a base (sideways trend) and a drop (downtrend.) I’ve marked in just a couple of potential entry points this long term trader could have taken. Each of these trades may have lasted a couple of weeks to a couple of months, if the trader was patient enough to hold that long.
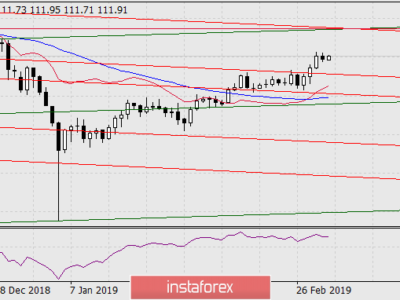
In this ten minute chart of the USDJPY a nearly identical pattern to the weekly chart emerged. A similar rally-base-drop is obvious, and again I’ve marked out a couple of potential trades. Each of these trades would have lasted just a couple of hours. Notice the similarities in what each trader would look for?

Here are a couple of examples of sideways trading in the AUDUSD. The chart on the left is a daily with a few long and short trades indicated in demand and supply. The chart on the right shows a very similar pattern, just on a one hour chart. Again, notice the similarities? So, the real question is, how can we use this information to make money trading? I’m glad you asked.
Imagine you are looking at a chart of a certain currency pair and aren’t sure how to trade it. Perhaps you are looking at a four hour chart. As this chart develops, I guarantee you that the same (similar) pattern will have already happened at some time in the past, perhaps on a different timeframe.
Here’s an idea: look back in time and see if you can recognize the same pattern and see what happens next. Then you can trade the current live chart accordingly. Of course I want you to sell in a quality supply zone and buy in a quality demand zone, which goes along with Online Trading Academy’s core strategy. But when you know that the past charts can show you what your current charts will probably do,![]() don’t you think trading will be easier?
don’t you think trading will be easier?

As I’ve stated in numerous previous newsletters, trading is a lot like driving. Every day your drive to your favorite store is a little bit different, but the basics are the same. Same turns, same roads, just the traffic is a bit different. The same applies to charts and patterns; every chart will be just a bit different but the main patterns constantly repeat over time.
Until next time,
Rick Wright – rwright@tradingacademy.com
Source:: All Trading Styles are the Same