
Previous Story
How You Can Trade Reversals With The Harami
Posted On 15 Aug 2014
Comment: 0
The reversal strategy almost has a bad name amongst traders. After all, the trend is your friend – and if there is a bias in the marketplace, then trading in the opposite direction of that bias is akin to saying ‘I know something that the market doesn’t.’
These types of scenarios rarely end well…
But just as we looked at in our trend trading article last month, whenever we’re looking to ‘buy low’ or ‘sell high’ in a trend we’re, in essence, trading a shorter-term reversal in the direction of the longer-term trend. In this article, we’re going to look at one of the more operative patterns for that endeavor.
How One Can Trade a Reversal
So, we’ve touched on the danger of the reversal: It’s a counter-trend type of strategy (even if trading in the direction of the longer-term trend). The very act of looking to go long when prices have been retracing lower (in a bigger picture up-trend), means that the trader going against the grain.
Going against the grain means that there will be times in which the trader is wrong. A recent example took place in GBPUSD. In the article, How to Attack Trends Using Price Action, I had looked at GBPUSD as a candidate for a longer-term trending position. As I had outlined in the article, the pair had recently ran to a new six-year high above 1.7150, and I was looking for opportunities to get long.
The big question was whether or not this up-trend had set its ‘higher-low,’ as prices were continuing to move lower in the retracement.
So, the longer term up-trend was re-tracing lower, and I was looking to initiate a long position in the pair (trading the longer-term trend, but playing a reversal of the shorter-term retracement). I showed the full setup in the following chart:
Trading a short-term reversal for the longer-term trend in GBPUSD
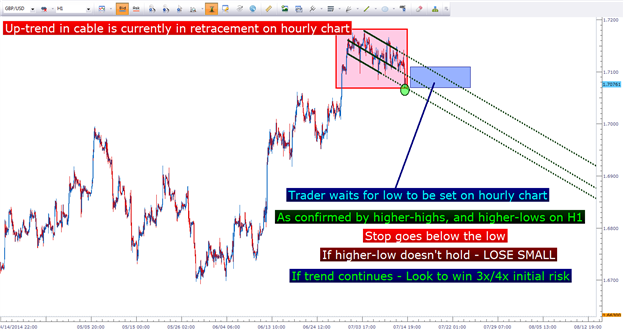
At the time of that article, GBPUSD was trading in the 1.7090 area. And if you look at how GBPUSD has performed since then – it hasn’t been pretty. The longer-term uptrend is now in question as that shorter-term retracement has continued ripping lower; falling below 1.6700 this morning.
Reversals can be dangerous: And if left unchecked (without a protective stop); extremely costly.
This is the nature of trading retracements. The very act of going against the grain means that you’re going to have to be prepared to take a loss if the reversal doesn’t play out. And if the reversal does work – that’s when you need to look to make two, three, or four times the amount that you had to risk in the first place.
Risk-Reward is The Number One Mistake Forex Traders Make; and the reversal formation can expose these mistakes perhaps even more so than any other type of condition.
If that shorter-term retracement turns into a longer-term trend; and if you’re on the wrong side of the move the entire time – it takes just one really bad trade to wipe away the gains from many, or even all of your successful positions.
Risk management is not optional for trading reversals – it’s a necessity. Otherwise, that trader probably won’t be trading for very long. Remember, any trade is but one of thousands of insignificant little trades in a trader’s career. It takes a lot of winning trades to build an account, and just one or two really bad ones to tear it back down.
The Harami
The Bullish and Bearish Harami are early-stage reversal formations. The down-side of this being such an ‘early’ formation is that it may not follow-through as often as a more confirmed formation might. But accordingly – if it does follow-through the potential upside may be larger (it’s funny the way these tradeoffs are persistent across markets… there’s no free lunch).
The Harami is a two-candle formation that shows a big move in the first candle, followed by an inside bar on the second; indicating that a reversal may be afoot.
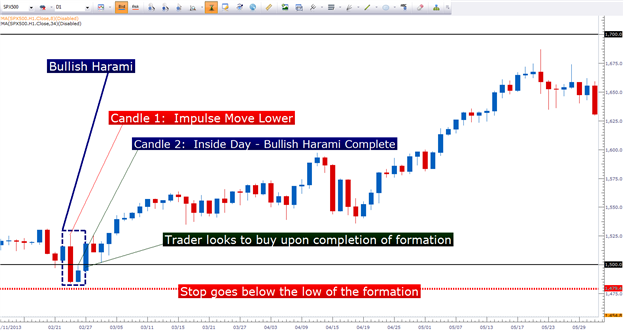
In the below chart, we look at a recent Bullish Harami formation in the S&P 500.
The Bullish Harami can lead to big moves
Created with Marketscope/Trading Station II; prepared by James Stanley
In the above chart of the S&P 500, notice how the Bullish Harami had shown up during the retracement of this up-trend. The two candle formation (outlined in the blue-dashed box) marks the low of the retracement before the up-trend gets back in order.
Just as we had mentioned above, risk management is extremely important for reversal formations, so the trader would likely want to look to put the stop for the position below the low of the formation. If there is a strong support level in the vicinity of that swing low, the trader can look to incorporate that as well. We had discussed this premise in The Power of Confluence, in explaining how traders can look to incorporate support and/or resistance from other methods of analysis (such as pivot points or psychological whole numbers).
The Bearish Harami is the exact opposite of the Bullish, in that the first candle of the formation will be a impulse move higher, followed by an inside day in candle 2. At that point, the trader can look for a short position with a stop above the high of the formation.
In the below chart, we look at a recent Bearish Harami that had shown up on the EURUSD daily chart.
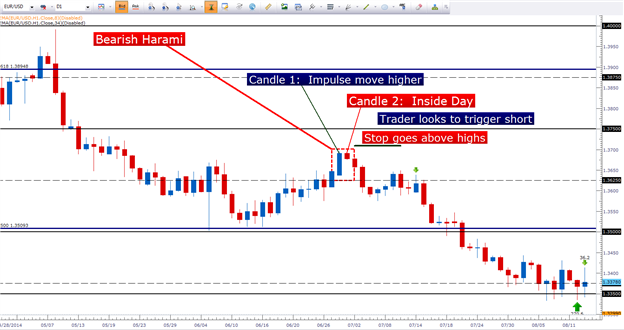
Created with Marketscope/Trading Station II; prepared by James Stanley
In our next article, we’ll take this formation a step further by investigating the morning star and evening star patterns.
— Written by James Stanley
James is available on Twitter @JStanleyFX


