
Previous Story
Daily analysis of GBP/USD for February 07, 2018
Posted On 06 Feb 2018
Comment: 0
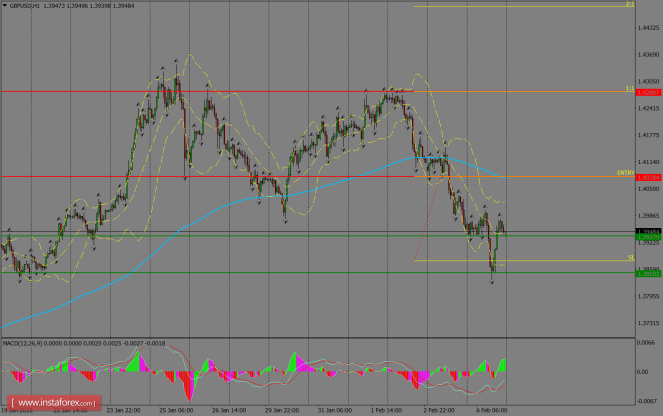
The pair extended the decline during Tuesday’s session, but later it trimmed some of the losses and remained supported by the 1.3850 level. A bullish move could take place at this stage, focusing on the 200 SMA at the H1 chart, at which a breakout should expose the 1.4280 level. MACD indicator supports the bullish scenario, as it stays in the positive territory.
H1 chart’s resistance levels: 1.4078 / 1.4280
H1 chart’s support levels: 1.3937 / 1.3850
Trading recommendations for today: Based on the H1 chart, buy (long) orders only if the GBP/USD pair breaks a bullish candlestick; the resistance level is at 1.4078, take profit is at 1.4280 and stop loss is at 1.3878.
The material has been provided by InstaForex Company – www.instaforex.com


