
Previous Story
Daily analysis of GBP/USD for February 12, 2018
Posted On 11 Feb 2018
Comment: 0
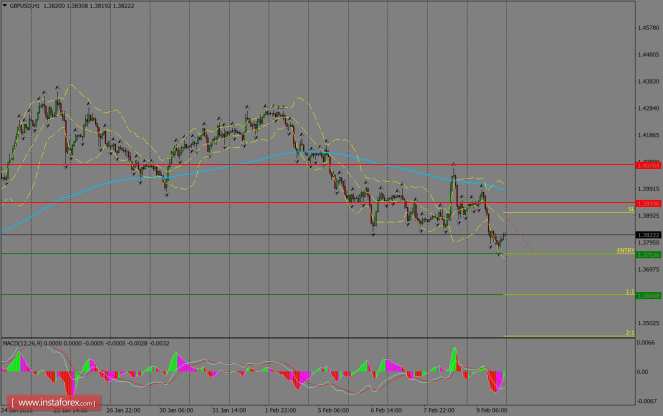
GBP/USD already broke to the downside in order to post another fresh low across the board. Below the 200 SMA at the H1 chart, the pair remains under pressure and it seems that we could expect a breakout of the 1.3753 level that should take it towards the 1.3604 zone. MACD indicator is entering the neutral territory, calling for a lower low pattern formation.
H1 chart’s resistance levels: 1.3939 / 1.4078
H1 chart’s support levels: 1.3753 / 1.3604
Trading recommendations for today: Based on the H1 chart, sell (short) orders only if the GBP/USD pair breaks a bearish candlestick; the resistance level is at 1.3753, take profit is at 1.3604 and stop loss is at 1.3903.
The material has been provided by InstaForex Company – www.instaforex.com


