
Previous Story
Daily analysis of GBP/USD for February 16, 2018
Posted On 16 Feb 2018
Comment: 0
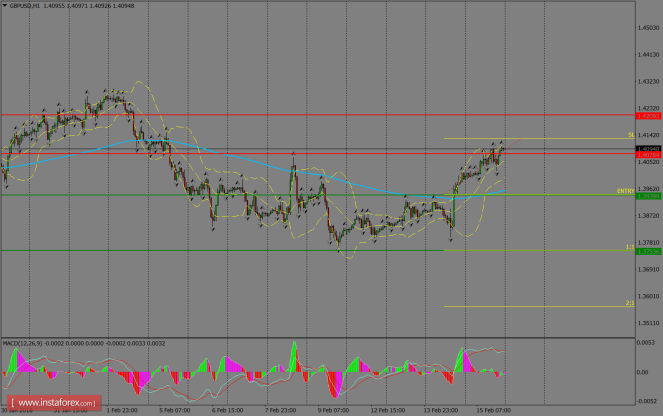
GBP/USD has been consolidating gains above the 200 SMA at H1 chart and having a break above the 1.3939 level, then we might expect a rally to test the 1.4209 level. At the current stage, it’s likely to see a pullback to resume the bearish bias once again. MACD indicator remains slightly in the neutral territory, calling for further consolidation.
H1 chart’s resistance levels: 1.4078 / 1.4209
H1 chart’s support levels: 1.3939 / 1.3753
Trading recommendations for today: Based on the H1 chart, sell (short) orders only if the GBP/USD pair breaks a bearish candlestick; the resistance level is at 1.3939, take profit is at 1.3753, and stop loss is at 1.4130.
The material has been provided by InstaForex Company – www.instaforex.com


