
Previous Story
Daily analysis of GBP/USD for August 16, 2017
Posted On 16 Aug 2017
Comment: 0
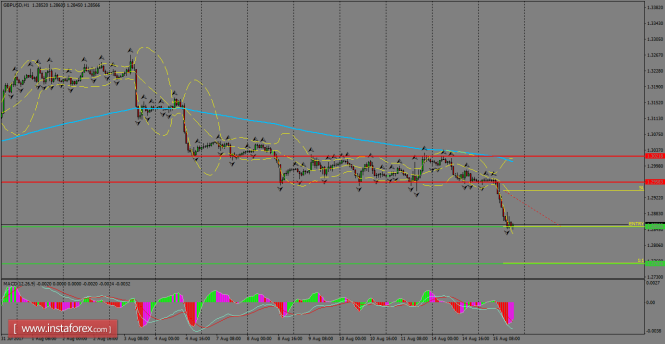
The pair had a quite volatile session amid holidays in most of the European countries on Tuesday. Support zone of 1.2850 is being challenged by the bears and if we see a breakout below that area, we can expect further continuation towards the 1.2761 level. Such move strengthened the bearish bias and one could expect more downside in the days ahead. MACD indicator is entering the oversold territory.
H1 chart’s resistance levels: 1.2958 / 1.3021
H1 chart’s support levels: 1.2850 / 1.2761
Trading recommendations for today: Based on the H1 chart, sell (short) orders only if the GBP/USD pair breaks a bearish candlestick; the support level is at 1.2850, take profit is at 1.2761 and stop loss is at 1.2938.
The material has been provided by InstaForex Company – www.instaforex.com


