
Previous Story
Daily analysis of GBP/USD for August 18, 2017
Posted On 18 Aug 2017
Comment: 0
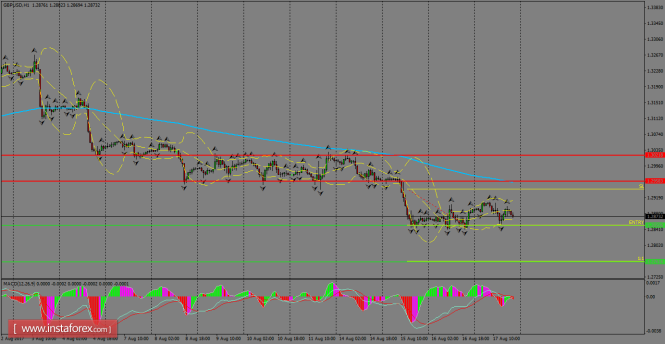
GBP/USD still holds the support level of 1.2850 and one could expect a recovery to re-test the 200 SMA at H1 chart. Nothing has changed since our latest report about the pair, but the risk is still targeting to the downside and if it breaks below 1.2850, further declines are expected to take place towards 1.2761.
H1 chart’s resistance levels: 1.2958 / 1.3021
H1 chart’s support levels: 1.2850 / 1.2761
Trading recommendations for today: Based on the H1 chart, sell (short) orders only if the GBP/USD pair breaks a bearish candlestick; the support level is at 1.2850, take profit is at 1.2761 and stop loss is at 1.2938.
The material has been provided by InstaForex Company – www.instaforex.com


