
Previous Story
Daily analysis of GBP/USD for December 12, 2017
Posted On 12 Dec 2017
Comment: 0
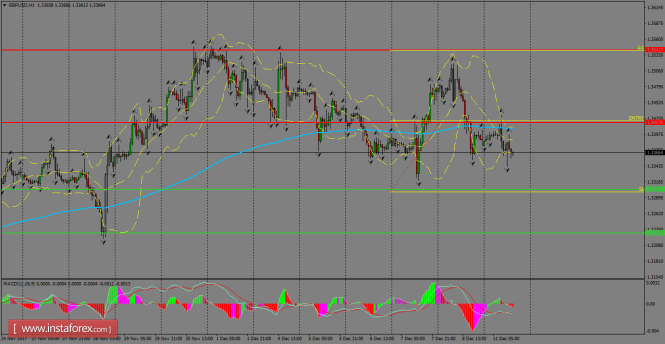
GBP/USD remains in sideways around the 200 SMA on H1 chart and the critical level of 1.3300 can be tested in coming hours. We can’t see yet a clear path that the pair can follow in the short term, but once it breaks above 1.3417, doors can be opened in order to test the resistance zone of 1.3541. MACD indicator remains in favor of the bears.
H1 chart’s resistance levels: 1.3417 / 1.3541
H1 chart’s support levels: 1.3303 / 1.3228
Trading recommendations for today: Based on the H1 chart, buy (long) orders only if the GBP/USD pair breaks a bullish candlestick; the resistance level is at 1.3417, take profit is at 1.3541 and stop loss is at 1.3298.
The material has been provided by InstaForex Company – www.instaforex.com


