
Previous Story
Daily analysis of GBP/USD for February 16, 2017
Posted On 16 Feb 2017
Comment: 0
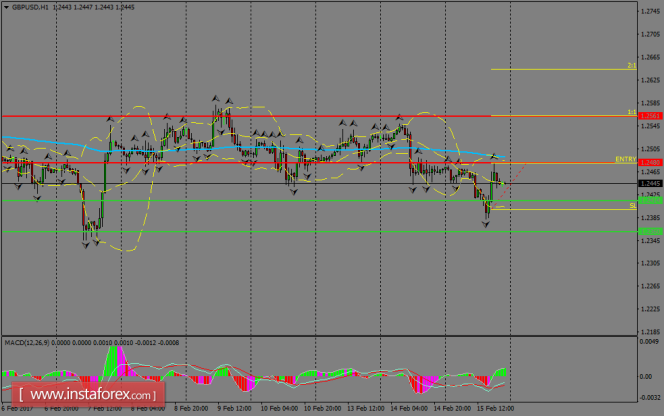
The pair was trading in a bearish tone during Wednesday’s session, consolidating its price action below the 200 SMA at H1 chart and that should be giving us a hint of further declines in the short-term. If GBP/USD manages to break below the support zone of 1.2414, then we can expect another bearish advance toward 1.2360. MACD indicator is entering the positive territory, favoring to a possible recovery in the Cable.
H1 chart’s resistance levels: 1.2480 / 1.2561
H1 chart’s support levels: 1.2414 / 1.2360
Trading recommendations for today: Based on the H1 chart, buy (long) orders only if the GBP/USD pair breaks a bullish candlestick; the resistance level is at 1.2480, take profit is at 1.2561 and stop loss is at 1.2398.
The material has been provided by InstaForex Company – www.instaforex.com


