
Previous Story
Daily analysis of GBP/USD for February 17, 2017
Posted On 17 Feb 2017
Comment: 0
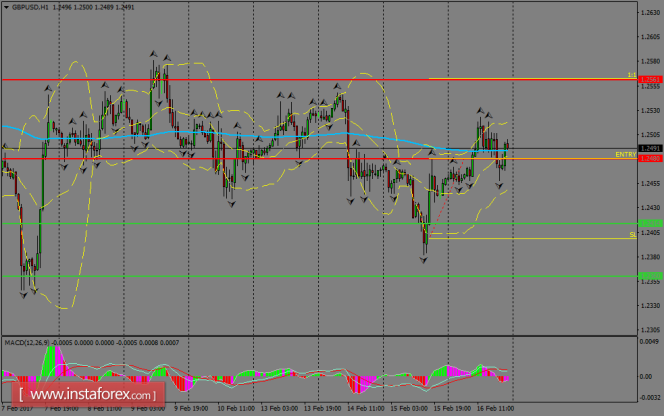
GBP/USD is hovering around the 200 SMA at H1 chart, looking for fresh momentum to visit the 1.2561 zone across the board, but the bulls are struggling at this stage. That’s why we cannot discard at all the idea of a possible bearish bias to develop below that moving average in order to test the support level of 1.2414. MACD indicator is entering the negative territory.
H1 chart’s resistance levels: 1.2480 / 1.2561
H1 chart’s support levels: 1.2414 / 1.2360
Trading recommendations for today: Based on the H1 chart, buy (long) orders only if the GBP/USD pair breaks a bullish candlestick; the resistance level is at 1.2480, take profit is at 1.2561 and stop loss is at 1.2398.
The material has been provided by InstaForex Company – www.instaforex.com


