
Previous Story
Daily analysis of GBP/USD for February 21, 2017
Posted On 21 Feb 2017
Comment: 0
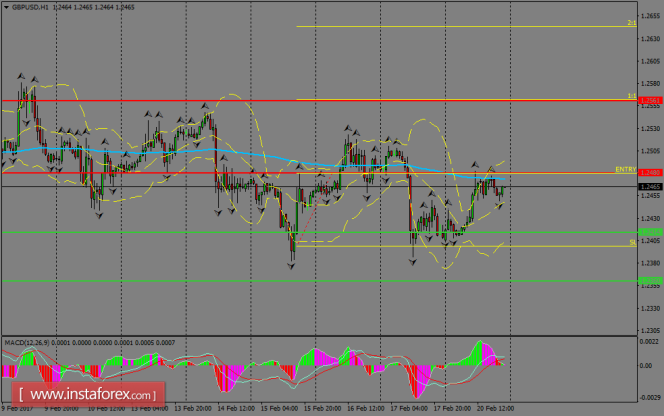
GBP/USD is finding dynamic resistance across the board at 200 SMA in the H1 chart and we’re expecting to see some pullbacks in coming hours. If that happens, one decline to test the 1.2414 level is highly likely to happen and a breakout below there should open the doors to test the 1.2360 zone. MACD indicator is reaching overbought conditions, favoring that scenario.
H1 chart’s resistance levels: 1.2480 / 1.2561
H1 chart’s support levels: 1.2414 / 1.2360
Trading recommendations for today: Based on the H1 chart, buy (long) orders only if the GBP/USD pair breaks a bullish candlestick; the resistance level is at 1.2480, take profit is at 1.2561 and stop loss is at 1.2398.
The material has been provided by InstaForex Company – www.instaforex.com


