
Previous Story
Daily analysis of GBP/USD for July 25, 2017
Posted On 25 Jul 2017
Comment: 0
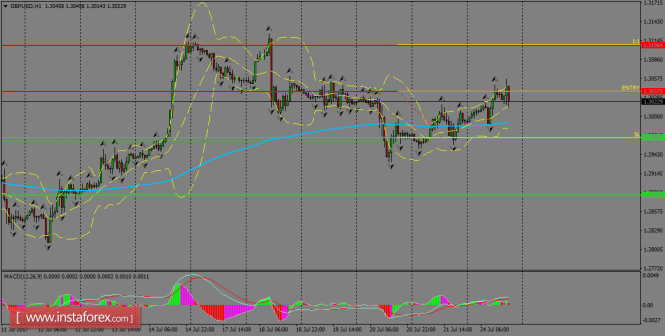
In the start of the week, GBP/USD started to retrace from the resistance zone of 1.3037, but it looks like the path for the week will be bullish as the pair is consolidated above the 200 SMA at H1 chart. That’s why we expect a breakout above 1.3037 in order to test the 1.3106 level. MACD indicator remains in the neutral territory, calling for sideways.
H1 chart’s resistance levels: 1.3037 / 1.3106
H1 chart’s support levels: 1.2968 / 1.2882
Trading recommendations for today: Based on the H1 chart, buy (long) orders only if the GBP/USD pair breaks a bullish candlestick; the resistance level is at 1.3037, take profit is at 1.3106 and stop loss is at 1.2968.
The material has been provided by InstaForex Company – www.instaforex.com


