
Previous Story
Daily analysis of GBP/USD for November 27, 2017
Posted On 26 Nov 2017
Comment: 0
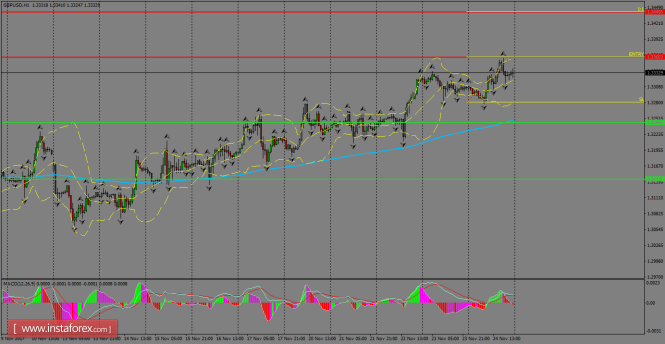
The pair rallied during Friday’s session despite thin liquidity due to the holidays in the United States. According to the H1 chart, GBP/USD tested the resistance zone of 1.3360 and our take profit was activated around that area. If that level gets broken by the price action, the next target should be the 1.3440 level. MACD indicator is entering the negative territory, calling for further downside.
H1 chart’s resistance levels: 1.3360 / 1.3440
H1 chart’s support levels: 1.3244 / 1.3143
Trading recommendations for today: Based on the H1 chart, buy (long) orders only if the GBP/USD pair breaks a bullish candlestick; the resistance level is at 1.3360, take profit is at 1.3440 and stop loss is at 1.3280.
The material has been provided by InstaForex Company – www.instaforex.com


