
Previous Story
Daily analysis of GBP/USD for September 08, 2017
Posted On 08 Sep 2017
Comment: 0
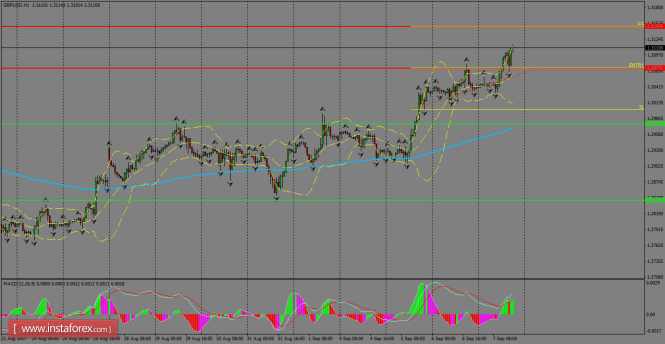
GBP/USD continues to ride a bullish sequence above the support level of 1.3073 and looks forward to testing the 1.3147 amid USD weakness across the markets. The 200 SMA is still providing a guide to the bulls and Bollinger bands have been showing an expansion, which should be an indication that a pullback might come soon. MACD indicator still supports the longs in the pair.
H1 chart’s resistance levels: 1.3073 / 1.3147
H1 chart’s support levels: 1.2976 / 1.2842
Trading recommendations for today: Based on the H1 chart, buy (long) orders only if the GBP/USD pair breaks a bullish candlestick; the resistance level is at 1.3073, take profit is at 1.3147 and stop loss is at 1.3000.
The material has been provided by InstaForex Company – www.instaforex.com


