
Previous Story
Daily analysis of USDX for April 16, 2018
Posted On 15 Apr 2018
Comment: 0
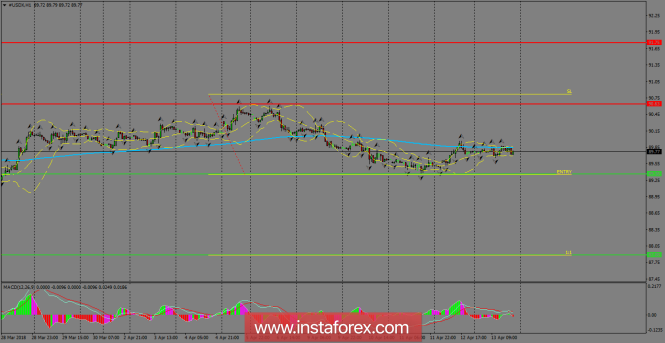
USDX kept its neutral stance around the 200 SMA at H1 chart, which is helping to cap further gains in the index for the short-term. We’re still expecting a pullback to take place in order to break below 89.36, which should be a move that resumes the overall bearish structure seen in the greenback. MACD indicator is entering the negative territory, favoring to the bears.
H1 chart’s resistance levels: 90.63 / 91.75
H1 chart’s support levels: 89.36 / 87.88
Trading recommendations for today: Based on the H1 chart, place sell (short) orders only if the USD Index breaks with a bearish candlestick; the support level is at 89.36, take profit is at 87.88 and stop loss is at 90.81.The material has been provided by InstaForex Company – www.instaforex.com


