
Previous Story
Daily analysis of USDX for August 16, 2017
Posted On 16 Aug 2017
Comment: 0
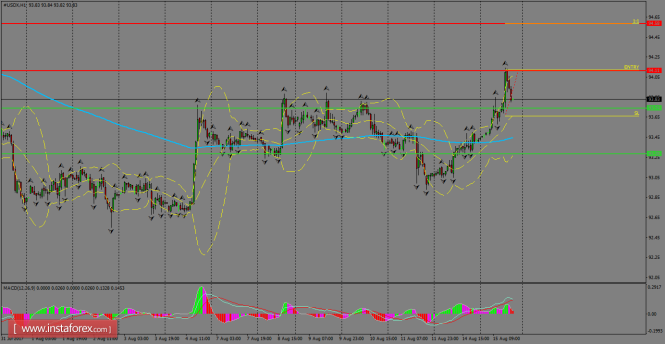
USDX had a strong rally and was the strongest currency against the major competitors and it’s now consolidating above the 200 SMA at H1 chart. To the upside, a resistance can be found around the 94.11 level, at which a breakout should expose the 94.58 level, while a pullback can take the index to retest the 200 SMA.
H1 chart’s resistance levels: 94.11 / 94.58
H1 chart’s support levels: 93.74 / 93.28
Trading recommendations for today: Based on the H1 chart, place buy (long) orders only if the USD Index breaks with a bullish candlestick; the resistance level is at 94.11, take profit is at 94.58 and stop loss is at 93.66.
The material has been provided by InstaForex Company – www.instaforex.com


