
Previous Story
Daily analysis of USDX for December 01, 2017
Posted On 01 Dec 2017
Comment: 0
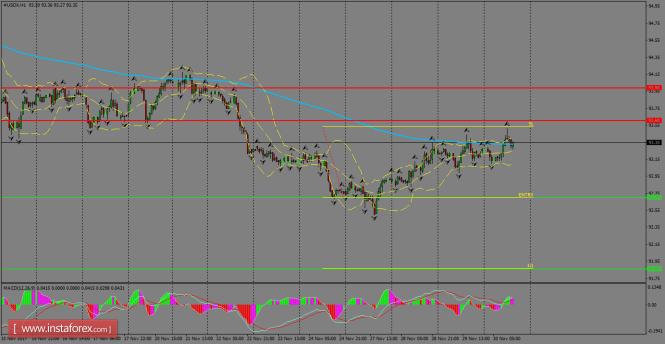
The index is finding dynamic resistance in the 200 SMA at H1 chart and still awaits to resume the bearish bias in the short-term. We’re still expecting that USDX could make a test of the 92.70 level, while to the upside, if it breaks above the 93.60 level, then we should forecast a rally towards the 94.00 psychological zone.
H1 chart’s resistance levels: 93.60 / 93.98
H1 chart’s support levels: 92.70 / 91.85
Trading recommendations for today: Based on the H1 chart, place sell (short) orders only if the USD Index breaks with a bearish candlestick; the support level is at 92.70, take profit is at 91.85 and stop loss is at 93.53.
The material has been provided by InstaForex Company – www.instaforex.com


