
Previous Story
Daily analysis of USDX for March 27, 2017
Posted On 27 Mar 2017
Comment: 0
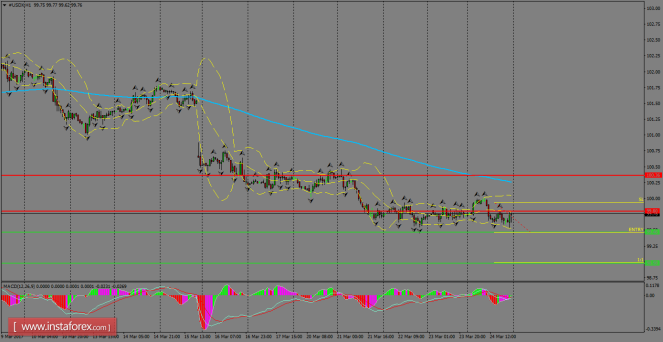
The index remains targeting to the downside, as it’s keeping the
structure below the 200 SMA at H1 chart, but eventually, we could
start to witness some recovery moves toward 100.36 in a first degree.
However, if USDX does a breakout below the 99.46 level, then it can
plunge to test the 98.98 level. MACD indicator is showing uncertainty
in the US Dollar so far.
H1 chart’s resistance
levels: 99.80 / 100.36
H1 chart’s support levels: 99.46
/ 98.98
Trading recommendations for today:
Based on the H1 chart, place
sell (short)
orders only if the USD Index
breaks with
a bearish
candlestick;
the support
level is at
99.46,
take profit is at
98.98
and stop loss is at 99.95.
The material has been provided by InstaForex Company – www.instaforex.com


