
Previous Story
Daily analysis of USDX for March 29, 2017
Posted On 29 Mar 2017
Comment: 0
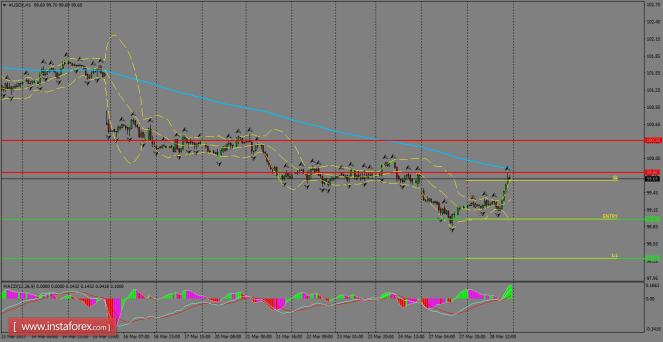
The index recovered during yesterday’s session, as it found strong
support around 99.00. Currently, USDX is challenging the 200 SMA at
H1 chart close to the 100.00 psychological area. If it manages to
break above that zone, then it’s likely to see a rally towards
100.36 in a first degree. MACD indicator is reaching the positive
territory, calling for more bullish moves in the short-term.
H1 chart’s resistance
levels: 99.80 / 100.36
H1 chart’s support levels: 98.98
/ 98.29
Trading recommendations for today:
Based on the H1 chart, place
sell (short)
orders only if the USD Index
breaks with
a bearish
candlestick;
the support
level is at
98.98,
take profit is at
98.29
and stop loss is at 99.66.
The material has been provided by InstaForex Company – www.instaforex.com


