
Previous Story
Daily analysis of USDX for September 15, 2017
Posted On 15 Sep 2017
Comment: 0
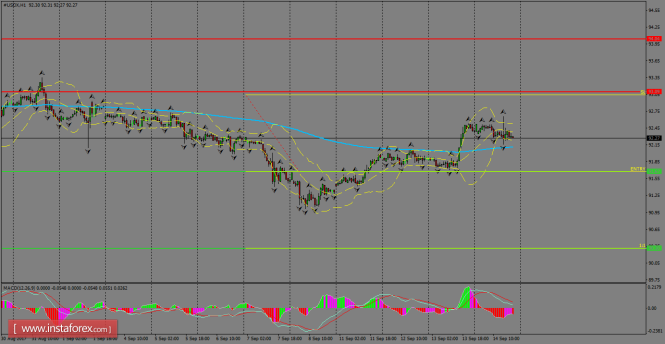
The index plummeted to around the 200 SMA on H1 chart and price action seems to be in favor of the bulls, despite overall weakness across the board. To the downside, we’re expecting a support around 91.67, at which a breakout should expose the next target at the 90.30 level. However, a recovery cannot be discarded at this stage and it should be limited by the 93.09 level.
H1 chart’s resistance levels: 93.09 / 94.04
H1 chart’s support levels: 91.67 / 90.30
Trading recommendations for today: Based on the H1 chart, place sell (short) orders only if the USD Index breaks with a bearish candlestick; the support level is at 91.67, take profit is at 90.30 and stop loss is at 93.04.
The material has been provided by InstaForex Company – www.instaforex.com


