Previous Story
Daily Market Review – 02 November 2016
End of Day Technical Analysis Report for:
EURUSD, GBPUSD, AUDUSD, USDJPY
GOLD, and SP500
► EUR/USD: this market seems to have broken to the downside from the recent triangular consolidation but is still making higher lows. With all the selling pressure and the multiple bearish candlestick signals at the top of the consolidation we can expect the downside is more likely to prevail in the next few weeks. If we get a close below the 1.0820 level then the market will officially no longer be making higher lows and we can then expect price to re-test 1.0470. So there is the potential still for a decent Short trade. Question is when to go Short?
Friday’s daily pin bar at the 8ema and 1.1000 resistance is also an inside pin bar so potentially a Sell signal in itself and today’s spinning top doji is inside Friday’s candle so get ready for a major breakout.
Technical Recommendation: Looking for a major breakout. We slightly favour the downside.
EURUSD – Weekly

EURUSD – Daily

► GBP/USD: in the weekend’s STTS analysis we told our subscribers that this week we would be looking at how price reacts to the area around 1.5475 which had acted as strong resistance lately hoping to get a Sell signal there again, in line with our Fundamental Team’s bearish view. We also said that to the upside we would consider going Long if we get a close above the trendline and 1.5475. Today the market once again clearly rejected prices above 1.5475 and the trendline so the former scenario is now looking more likely.
Technical Recommendation: Looking to go Short.
GBPUSD – Daily


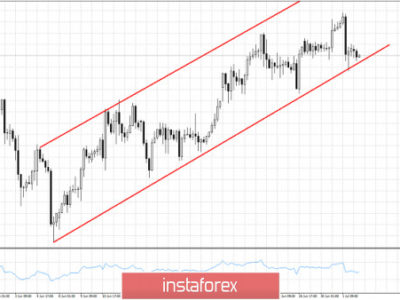
► AUD/USD: price appears to have bounce off the bottom of a rising channel and if that is true we should be looking to go Long looking for a retest of the top of the channel around 0.7500. So there is potential for a good long trade.
The Daily Chart is confusing as we have a falling 50 sma and a rising 20 ema. With a double bullish candle stick signal at confluent support of 0.7070, the bottom of the channel and the bottom Bollinger band, we should be looking to go Long and see if there is any mileage in this channel trade.
Technical Recommendation: Looking to go Long.
AUDUSD – Daily

► USDJPY: on Friday we got a bearish candlestick signal but we’re already close to the next level of support of 120.00. If price goes up a bit more there is scope for a short trade to 120 and then possibly to 118.70.
Technical Recommendation: Looking for pull back closer to 121.48-121.70 area to go Short.
USDJPY – Daily

► GOLD: we covered our STTS Short before the close on Friday to square off our book for end of month and also because we expected price to bounce off 1140 support. We were looking to re-enter Short but today we never got a retracement to do so. Of course, in hindsight, we now wish we had stayed Short. Next support is likely to be at the bottom of the channel around 1120.Technical Recommendation: Profit taken. Looking for a retracement to re-enter Short.
XAUUSD – Daily

► SP500: in this weekend’s Weekly Bonus Video we predicted 2 most likely scenarios for this week, given that price had reached 2100 resistance last week: either sideways consolidation or a retracement. Today ends instead with a very bullish candle which does point at the ‘unlikely’ scenario, according to us, of any immediate further upside. Price did however stop at 2100 again so we may still see a retracement from these levels tomorrow. If price does break above 2100, we are then likely to be testing all time highs again around 2133.
Technical Recommendation: still looking for price to stall at 2100 but it is less likely now.
SP500 – Daily

SP500 – Weekly
CHECK OUR INTERACTIVE ECONOMIC CALENDAR FOR UPCOMING WORLDWIDE DATA RELEASES
DISCLAIMERThe information contained in this publication is not intended as an offer or solicitation for the purchase or sale of any financial instrument. Users acknowledge and agree to the fact that, by its very nature, any investment in CFDs and similar and assimilated products is characterised by a certain degree of uncertainty and that, consequently, any investment of this nature involves risks for which the user is solely responsible and liable.Any recommendation, opinion or advice contained in such material reflects the views of TFF, and TFF expressly disclaims any responsibility for any decisions or for the suitability of any security or transaction based on it. Specifically, any decisions you may make to buy, sell or hold a security based on such research will be entirely your own and not in any way deemed to be endorsed or influenced by or attributed to TFF.Past performance should not be seen as an indication of future performance. Market and exchange rate movements may cause the value of your investment to rise or fall and an investor may not get back the amount invested.
Investors considering opening a self-trading account should limit their exposure to maximum 10% of their investment capital.
Investments are not obligations of, deposits in, insured or guaranteed by TFF.


