Previous Story
EUR/USD Mid-term Forecast

At the beginning of this week, the pair appears to be set for a further decline.
With the help of the Technical Analysis tools, I will try to delve deeper into the topic and identify the possible and most likely movement of EUR/USD for the next few days/weeks.
Elements to be considered for the Trading Forecast (Technical Analysis):
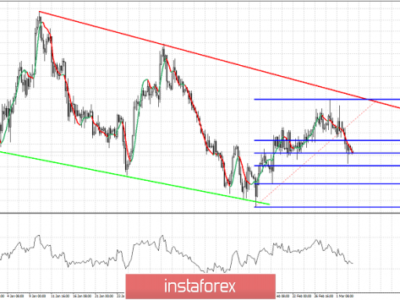
Let’s start from the Weekly chart (Image 1).
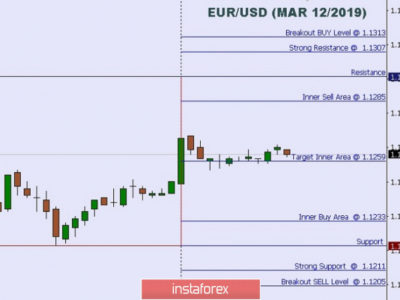
If we take a look at the activities of the exchange rate from the beginning of March, we can notice how it has moved almost sideways. Please also note how the Candle Patterns have defined very clear Support and Resistance levels and how the market has respected and reacted to them in the subsequent trading weeks.
PROs:
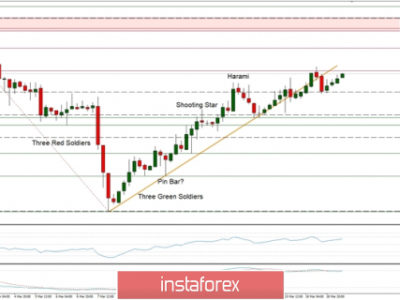
- Starting from the bottom of the Box Range, on the left we find (green arrows): 2 Piercing Patterns and 1 Bullish Engulfing; on the top side the most significant are: a couple of Bear Engulfings, a Bear Harami, a Shooting Star, a Bear Sash, an Engulfing, another Shooting Star and a 3 Black Crows (3 consecutive black candles with a lower close). After a series of such important bearish signals, it’s quite spontaneous to say the bears are “leading the dance…”
- a Rising Channel is in place (dotted line [4]); almost a former rising support line now acting as an oblique resistance line;
- The Shooting Star has bitten the Bollinger Band and also it has not been able to close above the Resistance level (red thick continuous line [1];
- Unable to close above 1.15 round number;
- Stochastic Divergence;
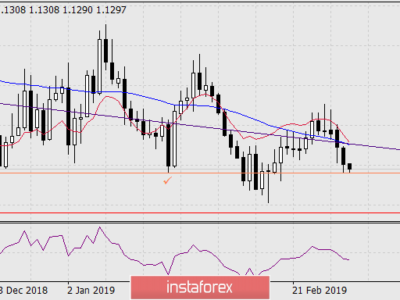
- Price is Below SMA200;
- Price has closed below the EMA (green line);
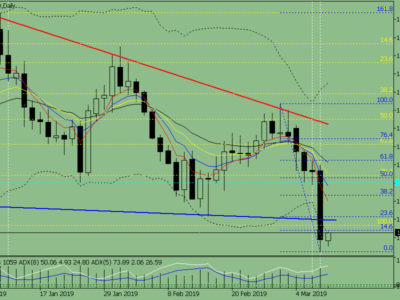
- Possible run to Turncoat Support [3] (red thick line in the middle of the horizontal box range) as Target 1 (Purple Row), identified by the Bear Sash [2] on the weeks of Dec 7-14 – 2015; it is also the 50% Fibo retracement of the last leg and the lower side of the Ascending Channel [4] (red dotted);
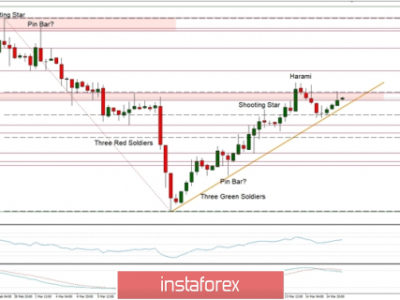
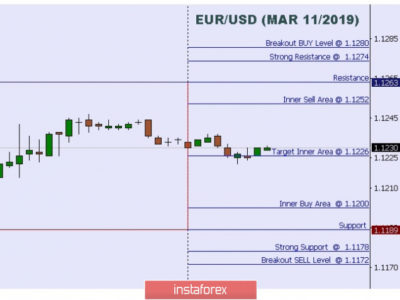
- About a possible downwards move, the Target to be monitored is a confluence of clues: the Daily area defined by the blue tick line [5] (please see at Daily Chart – Image 2 for a visual explanation), the projection of the lower Bollinger Band, the 76.40 Fibo Extension);
CONs:
- On W chart the SMA20 (blue) and SMA50 (Red) have just configured a Bull setting; NO other clear clues on this timeframe;
- On Daily Chart a minor resistance (defined by a Bull Engulfing, green arrow) is present in 1.1150 area; we may experience a rebound from this level (purple arrows for the projection of possible movements);
- On the Daily chart, last Friday formed a very small Bull Engulfing. It is of no interest for at least a couple of reasons: 1st, the size of the candles; 2nd, it appears at Supp now Resistance (Blue Rectangle). Only for a decisively close above this area we can take into account a Bull move;
- Harmonic Patter emerging in the same price area;
- On medium/long-term prediction, after a trend has been established, only a valid Candle Pattern (especially those that occur at a Support or Resistance levels), are the most reliable signs of a possible trend slowdown or a change of direction.

Any comments and suggestions below are very welcome.
Source:: EUR/USD Mid-term Forecast