
Previous Story
Forecast for NZD/USD for December 6, 2018
Posted On 06 Dec 2018
Comment: 0
NZD/USD
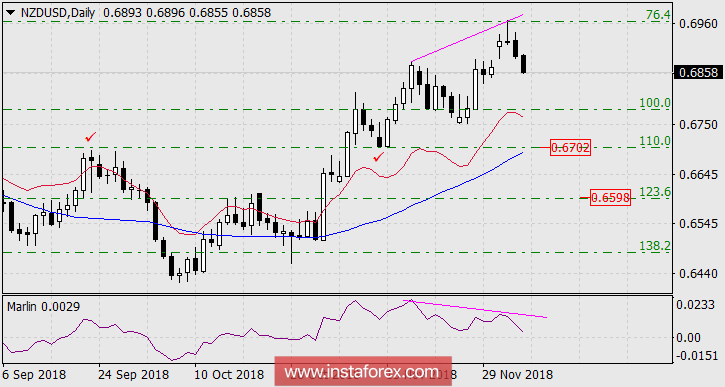
The growth of the New Zealand dollar ended this week’s testing areas of convergence of the Krusenstern line with a Fibonacci level of 76.4% on the weekly scale chart. Currently, the price is already below the indicator line of balance. The objectives of the decline also accept Fibonacci levels: 110.0% – 0.6702, 123.6% – 0.6598.
A divergence of the Marlin indicator with the price is formed on the daily scale chart. The support and significance of the first target are also confirmed on this scale by the Krusenstern line (it is approaching the Fibonacci level) and two historical extremums of the September price (peak) and November 12 (low).
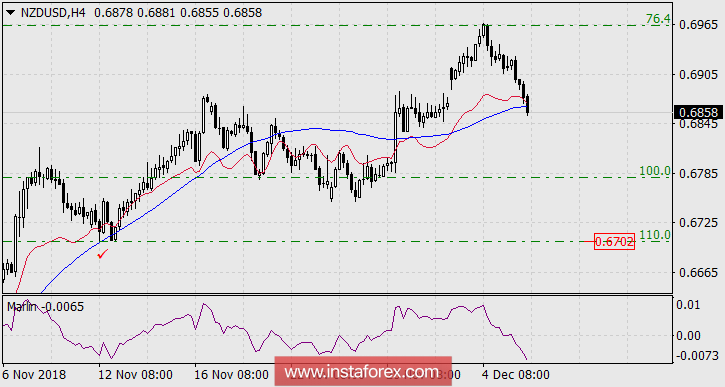
On the H4 chart, the price went under the balance line and the Krusenstern line this morning. Marlin oscillator signals a strong declining moment.
The material has been provided by InstaForex Company – www.instaforex.com


