Previous Story
Friday 20th March: Daily technical outlook and review.
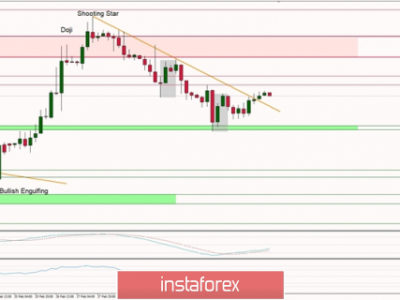
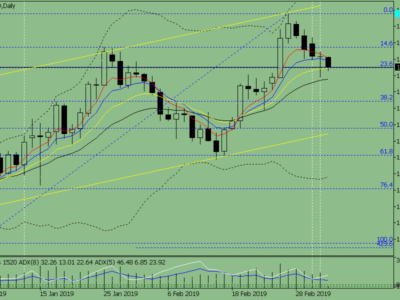
EUR/USD:
Weekly Timeframe: From the weekly timeframe, we can see that active selling recently entered the market at around 1.1036. Provided that the sellers can continue with this tempo, it is likely price will hit the long-term weekly swap level seen at 1.0411. It will be interesting to see what the lower timeframes have to say about this.
Daily Timeframe: The daily timeframe shows us that the sell off originated from around the daily swap level region at 1.0825. It also shows that in order for prices to reach the aforementioned weekly swap level, the sellers will need to take out a small daily demand area seen at 1.0468-1.0565.
4hr Timeframe: The latest coming in from the 4hr timeframe shows that the Euro’s recent fall took out not one, but two, psychological numbers yesterday (1.0800/1.0700) before landing around 4hr demand seen at 1.0578-1.0618, where, at the time of writing, supportive pressure is being seen. This area is significant for us since this is where pro money likely bought the market based on the FOMC’s latest showdown.
Buying the Euro here is not really something our team is comfortable doing without seriously attractive lower timeframe confirmation. The reasons for why are as follows:
- No clear support being seen on the higher timeframes at the moment (see above).
- The prevailing downtrend.
- The 4hr bear candle prior to the most recent 4hr bull candle was not exactly responsive, which could mean a further decline to find willing buyers may be on the cards.
Therefore, with all of the above in mind, our plan of action today is to closely monitor the behavior of lower timeframe price action around this 4hr demand zone. Should a nice-looking entry long be spotted here, we’ll look to ride this one up to at least 1.0700 before taking partial profits.
Current buy/sell orders:
- Buy orders: 1.0578-1.0618 [Tentative – confirmation required] (Predicative stop-loss orders seen at: 1.0572).
- Sell orders: Flat (Predicative stop-loss orders seen at: N/A)
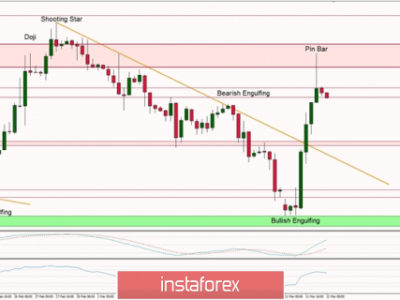
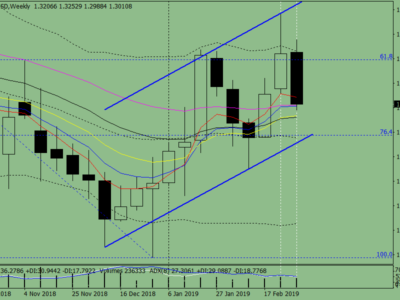
GBP/USD:
Weekly Timeframe: The weekly picture shows that the weekly Quasimodo resistance (prior support) level at 1.5007 is, at the time of writing, holding the market lower. Assuming that further downside is seen here, the GBP will very likely collide into a major weekly demand area visible at 1.4225-1.4482.
Daily Timeframe: Moving on to the daily timeframe, we can see that the recent sell off has plonked cable back into daily demand once again at 1.4686-1.4805. However, this demand area could very well be fragile from the break lower seen on Wednesday, so do bear this in mind if you’re considering longs today. That said, If this demand area gives way, we see very little stopping price dropping all the way down to a fresh daily demand area seen at 1.4343-1.4465 (located within the aforementioned weekly demand area).
4hr Timeframe: Like the Euro, the recent decline in value on the GBP took out both 1.4900 and 1.4800 before touching base with a 4hr Quasimodo support level at 1.4698. This hurdle is a key level for us since this is the area where pro money likely bought the market based on the FOMC meeting.
Given that the weekly chart is suggesting further selling may be on the cards, and the daily chart currently trading within a weak-looking demand area (see above), naturally we’re hesitant about longing this 4hr Quasimodo support level. That being said though, let’s not forget that this was a very active buy zone not too long ago, therefore, we’re still going to keep an eye on how lower timeframe price action develops here today.
In the event that a push below this 4hr Quasimodo level is seen, we’ll then expect price to test the low 1.4633, and, given enough time, the 1.4600 handle.
Current buy/sell orders:
- Buy orders: 1.4698 [Tentative – confirmation required] (Predicative stop-loss orders are seen at: N/A).
- Sell orders: Flat (Predicative stop-loss orders are seen at: N/A).
AUD/USD:
Weekly Timeframe: The weekly timeframe shows that the buyers and sellers are currently pulling for position within weekly demand seen at 0.7449-0.7678.
Daily Timeframe: Looking at the daily picture, we can see that price is now firmly capped between a daily decision-point supply area seen at 0.7859-0.7789, and a long-term daily demand area coming in at 0.7449-0.7598 (located deep within the aforementioned weekly demand).
4hr Timeframe: The AUD/USD pair sold off yesterday and broke below the 0.7700 handle, which, as you can see, consequently forced price down to 4hr demand coming in at 0.7572-0.7614.
Taking into account that both the weekly and daily timeframes are somewhat supportive of buying (see above) at the moment, we’re going to primarily be looking for longs today around the aforementioned 4hr demand area, with an overall target set at the 0.7700 level. Be that as it may, we are not comfortable entering at market here simply because the overall trend is still southbound. Therefore, entry will only be permitted on the basis of sound/obvious lower timeframe confirmation. For instance, check out the 30 minute timeframe; say price breaks above the high 0.7655 (potentially clearing out supply), and the market drops to 30 minute demand at 0.7612-0.7625, we’d confidently enter long here since price is now likely clear of major resistance up to 0.7700.
Current buy/sell orders:
- Buy orders: 0.7572-0.7614 [Tentative – confirmation required] (Predicative stop-loss orders seen at: 0.7569).
- Sell orders: Flat (Predicative stop-loss orders seen at: N/A).
USD/JPY:
Weekly Timeframe: Supportive pressure continues to be seen on the weekly timeframe from a small, yet clearly reactive weekly decision-point demand area at 118.22-119.40. In the event that further buying is seen on the basis of this support, we’ll likely see price shake hands with a major weekly Quasimodo resistance level coming in just above at 122.18.
Daily Timeframe: The daily timeframe on the other hand, shows that before the market can reach the aforementioned weekly Quasimodo resistance level, the buyers will have to chew through daily supply at 122.01-121.10. Let’s take a look at what the 4hr timeframe makes of this…
4hr Timeframe: The latest coming in from the 4hr timeframe reveals that price has been teasing the 121.00 handle. Selling from this number when support is being seen on the weekly timeframe is not something we have any interest in taking part in. A break above 121.00, however, would likely force the market to test an extremely attractive fresh 4hr supply zone at 121.39-121.21 (sells seen just below at 121.17). Apart from being located within the aforementioned daily supply area, this 4hr supply had fantastic momentum south (FOMC induced), and, as you can probably see, also converges nicely with a minor 4hr trendline extended from the high 121.66, therefore a bounce is expected should price reach here today.
As a final point, if price firmly closes above the aforementioned 4hr supply area, this will, at least for us anyway, suggest price is headed for the weekly Quasimodo resistance level mentioned above. The reason for why is simply because we see little active supply remaining to the left.
Current buy/sell orders:
- Buy orders: Flat (Predicative stop-loss orders seen at: N/A).
- Sell orders: 121.17 (Predicative stop-loss orders seen at: 121.42).
USD/CAD:
Weekly Timeframe: The weekly timeframe shows that buying has clearly entered the market, which, in our opinion, does not exactly say a lot for the stability of the weekly Quasimodo resistance level seen at 1.2765. Let’s see what the lower timeframes make of this…
Daily timeframe: From the daily picture, we can see that this recent buying activity on the weekly chart originated from a daily demand area seen at 1.2405-1.2517. For us to be convinced that this daily area has strength, and that the aforementioned weekly Quasimodo level is consumed, the buyers will have to convincingly punch above Wednesday’s high at 1.2833.
4hr Timeframe: The recent ascent from 4hr demand at 1.2423-1.2480 (located within the aforementioned daily demand) has only recently found resistance at the mid-level number 1.2750, which, as you can see, has forced the Loonie down to around the 1.2700 barrier.
In the event that this psychological level holds the market today, and pushes above 1.2750, this will likely suggest further weakness from the aforementioned weekly Quasimodo resistance level. Nonetheless, should price close lower today, this will not only clear the path down to at least 1.2650, but also highlight the fact that strength still may reside around the weekly Quasimodo level.
Given all the points made above, opting to stand on the sidelines here may be the best path to take until further development has been seen on this pair.
Current buy/sell orders:
- Buy orders: Flat (Predicative stop-loss orders seen at: N/A).
- Sell orders: Flat (Predicative stop-loss orders seen at: N/A).
USD/CHF:
Weekly Timeframe: Following the recent sell off from weekly supply seen at 1.0239-1.0131, buying pressure has recently been seen entering the market from around a weekly swap level coming in at 0.9663.
Daily Timeframe: There is not really much more to report on the daily timeframe other than to remind ourselves that price is now capped between the aforementioned weekly swap level, and a small daily supply area seen at 1.0090-1.0008, which, if you look back to the weekly chart, you’ll notice is actually a reaction to the aforementioned weekly supply area.
4hr Timeframe: From the 4hr timeframe, we can see that a little more upside has been seen since yesterday. This move consequently took out the 0.9900 handle, and is, at the time of writing, seen retesting this number as support. In the event that the buyers can successfully hold out above this level today, it is very likely price will rally to test parity (also the underside of the aforementioned daily supply area), and it would be at this level that we’d begin watching the lower timeframes for selling confirmation. The reason for needing confirmation here is simply because price could, and very likely will, fake above to the fresh 4hr supply at 1.0067-1.0035 (located within the daily supply area mentioned above).
Conversely, if price convincingly breaks below 0.9900 today, we see very little stopping the market from reaching at least the mid-level number 0.9850, and given enough time, potentially the 0.9800 barrier. Selling opportunities may be found if price retests 0.9900 as resistance.
Current buy/sell orders:
- Buy orders: Flat (Predicative stop-loss orders seen at: N/A).
- Sell orders: 1.0000 [Tentative – confirmation required] (Predicative stop-loss orders seen at: dependent on where one confirms this level).
DOW 30:
Weekly Timeframe: The weekly timeframe shows that price is back trading around the 18098 region. A convincing push above this number will likely see the DOW trade to new highs and continue on its six-year uptrend. It will be interesting to see what the lower timeframes think of this…
Daily Timeframe: Yesterday’s trading action saw the market react to a small daily supply area at 18160-18080, which, if you look back to the weekly chart, you’ll notice that this zone beautifully surrounds the aforementioned 18098 weekly level.
4hr Timeframe: From the pits of the 4hr timeframe, we can see that price recently reacted from 4hr supply coming in at 18164-18111 (located within the aforementioned daily supply area), and has, as you can probably see, pushed the DOW down towards a minor 4hr swap level visible at 17886.
So that we’re all on the same page here, let’s just quickly recap. The weekly chart shows price has been, and still is trending north, but has hit a blockade of sorts around 18098. Meanwhile on the daily chart, price is trading just under supply, a clear barrier that needs to be consumed in order for higher prices to be seen. So, where does this leave us on the 4hr timeframe? Well, we could try and short the aforementioned 4hr supply area today with lower timeframe confirmation, but keep in mind that by doing so you’ll likely be selling into the weekly trend, so be careful. On the other hand, should we see a break above this 4hr supply area, this will, in effect be our cue to begin watching for price to retest this area as demand.
Current buy/sell orders:
- Buy orders: Flat (Predicative stop-loss orders seen at: N/A).
- Sell orders: 18164-18111 (Predicative stop-loss orders seen at: 18176).
XAU/USD (Gold):
Weekly Timeframe: Buying interest has recently been seen on the weekly timeframe coming in from just above the weekly decision-point demand level at 1136.3.
Daily Timeframe: The recent ascent on Gold has pushed price up to 1170.5, an ignored daily Quasimodo line. In the event that price closes above this hurdle today, this will likely clear the path north for further buying towards a major daily swap level coming in at 1182.0. Let’s see what the 4hr timeframe makes of this…
4hr Timeframe: The 4hr timeframe shows that price has likely consumed a 4hr supply area coming in at 1175.2-1171.1 (seen just above the aforementioned ignored daily Quasimodo level), which has, as far as we can see, potentially paved the way north for the market to test the major daily swap level mentioned above at 1182.00. That being the case, it seems we may have missed the opportunity to enter long, as the train looks as though it has departed without us from a minor 4hr swap level seen at 1159.6.
That being the case, selling from 1182.00 could be our next port of call. This is a valid shorting zone as long as confirmation is seen from the lower timeframes. Confirmation is needed, in our opinion, for two reasons. Firstly, price could fake higher here to test the low 1188.3 as resistance, and secondly, one needs to remain aware that by selling here, you could be potentially be shorting into higher timeframe weekly buyers. So remain vigilant!
Current buy/sell orders:
- Buy orders: Flat (Predicative stop-loss orders seen at: N/A).
- Sell orders: 1182.0 [Tentative – confirmation required] (Predicative stop-loss orders seen at: N/A).
The post Friday 20th March: Daily technical outlook and review. appeared first on .
Source:: Friday 20th March: Daily technical outlook and review.