
Previous Story
Friday 27th June: Daily Technical Outlook and Review.
Posted On 27 Jun 2014
Comment: 0
For the readers’ benefit:
Price action confirmation: simply means traders will likely wait for price action to confirm a level by consuming the opposing supply or demand area, then entering a trade on a possible retracement, this may occur on the lower timeframes also.
Pending orders: means pending orders are likely seen.
EUR/USD:
Daily TF.
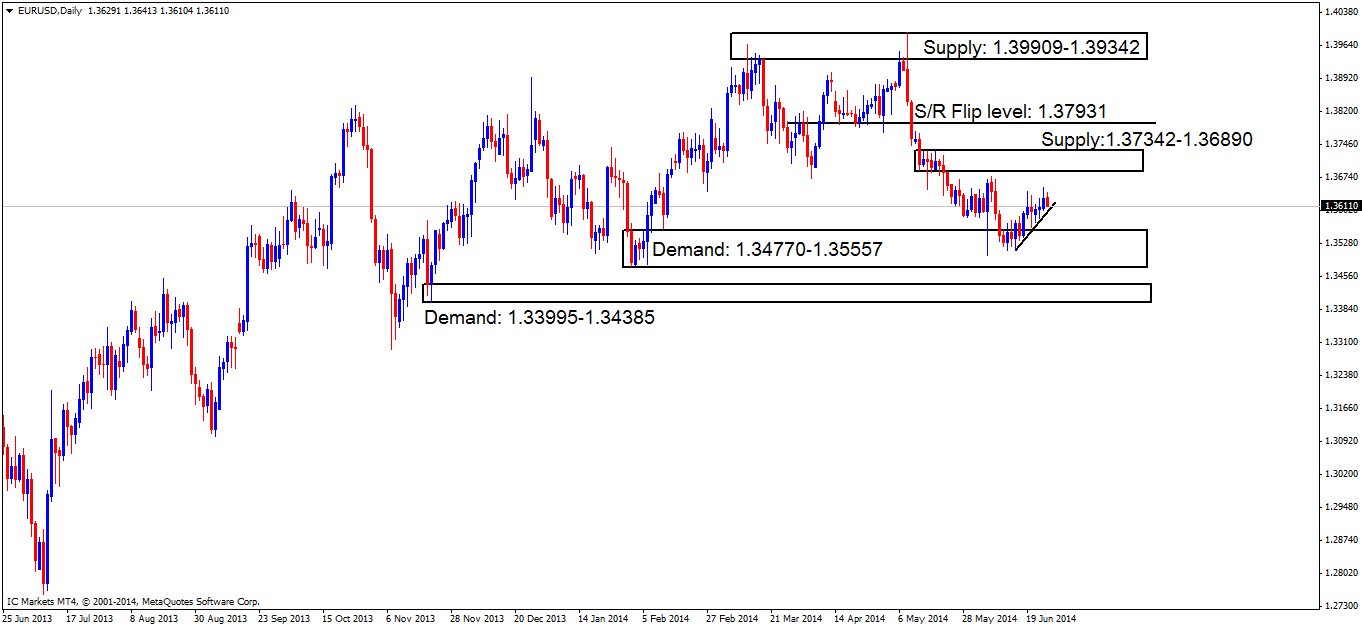
Not much of a change has been seen to the daily timeframe price action, as we still see price capped between supply above at 1.37342-1.36890 and demand below at 1.34770-1.35557.
The small trendline placed on the chart is not there to represent a trend, it is more to show how pro money may be consuming small pockets of demand as price is rallying higher, thus clearing a path south for sellers to take over.
4hr TF.
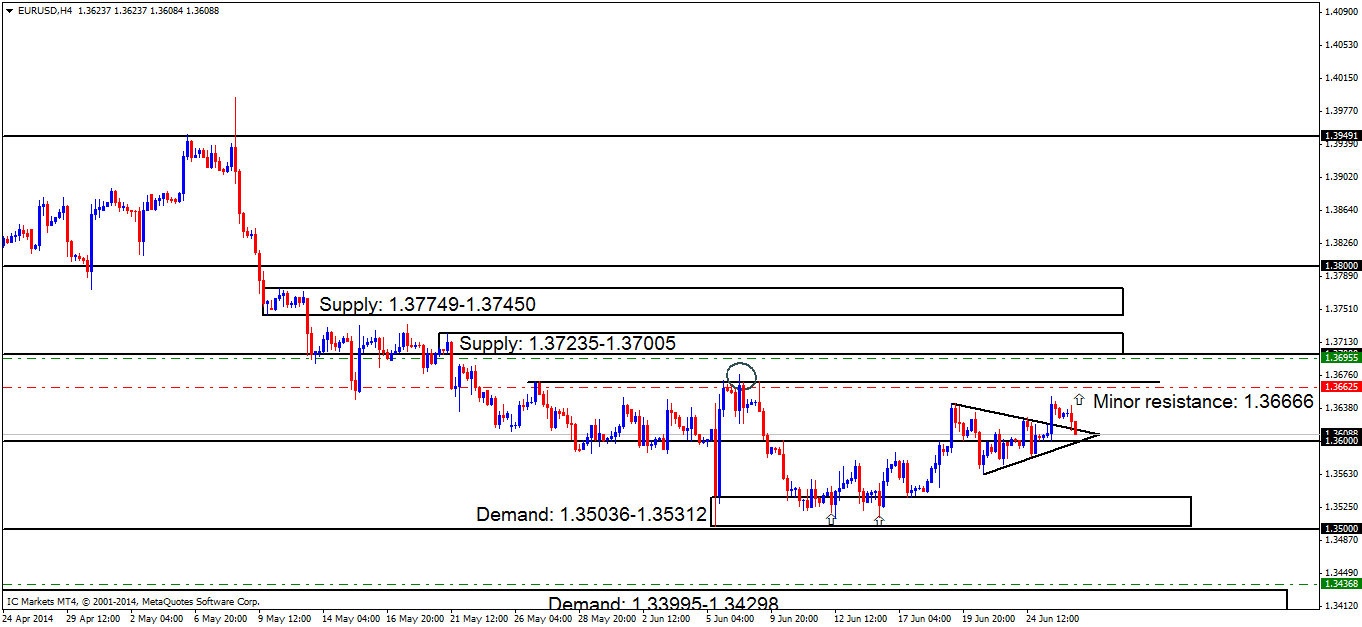
A breakout north of the ascending triangle has been seen, and is currently seen retesting it. On the breakout north, price missed the minor resistance level at 1.36666 by about 15 pips, if price successfully retests the triangle, a push higher to the minor resistance level may well be seen sometime today.
This was written a few days ago while analyzing this pair, but still holds true and is worth remembering:
Price still remains capped between demand below at 1.35036-1.35312 and supply above at 1.36666 (minor resistance). A break above this supply could see price testing oncoming supply at 1.37235-1.37005; conversely, if price breaks the demand area (levels above) below, price could very well hit demand at 1.33995-1.34298.
Pending/P.A confirmation orders:
- Pending buy orders (Green line) are seen around demand (1.33995-1.34298) at 1.34368. This demand area will more than likely see some sort of reaction due to its location seen to the left.
- No P.A confirmation buy orders (Red line) are seen in the current market environment.
- Pending sell orders (Green line) seen at 1.36955 just below supply at 1.37235-1.37005 are set here since this level remains untouched, meaning unfilled orders are likely still set around this area.
- P.A confirmation sell orders (Red line) are visible below the minor resistance 1.36666 at 1.36625, this level has proved valid in the past, but still needs to be confirmed due to a spike/wick (circled) seen above resistance, which may have consumed most of the sellers originally there. Do be on your guard with the sell orders above; the higher-timeframes are currently indicating higher prices may happen soon (Weekly demand: 1.34770-1.36771).
Quick Recap:
The price action seen on the daily timeframe appears to be showing weakness when it left daily demand at 1.34770-1.35557, while on the 4hr timeframe a breakout of the ascending triangle has been seen, where price is currently retesting it at the moment. A spike south towards the round number 1.36000 may happen, collecting stops from eager buyers, where an advance up to at least the minor resistance area at 1.36666 is expected, however, do bear in mind that the daily timeframe is not showing strong buying in the market at present, so remain aware of this fact today when considering any long positions.
- Areas to watch for buy orders: P.O: 1.34368 (SL: 1.33926 TP: Dependent on how price action approaches the zone) P.A.C: No P.A confirmation orders seen in the current market environment.
- Areas to watch for sell orders: P.O: 1.36955 (SL: 1.37270 TP: [1] 1.36666 [2] 1.36000) P.A.C: 1.36625 (SL: 1.36810 TP: Dependent on where price ‘confirms’ the level).
GBP/USD:
Weekly TF.
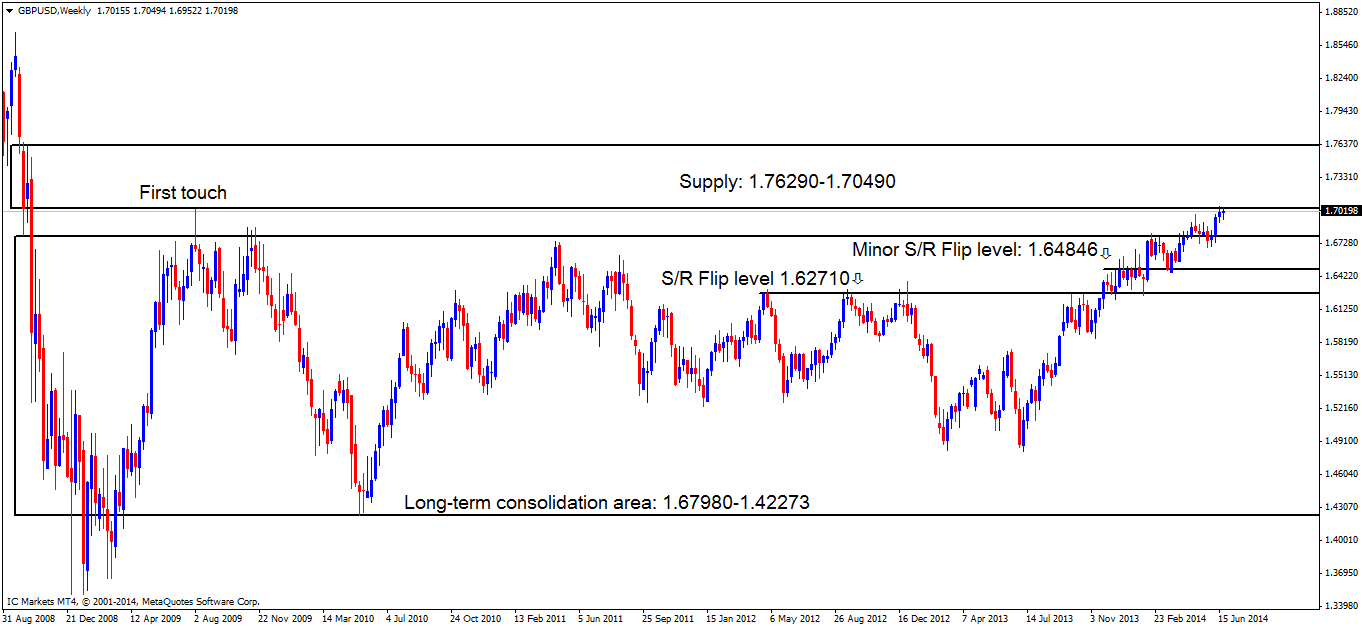
It appears that sellers are beginning to run out of steam, no positive bearish price action is currently being seen, so a push deeper within weekly supply at 1.76290-1.70490 may well be expected to happen soon.
Daily TF.
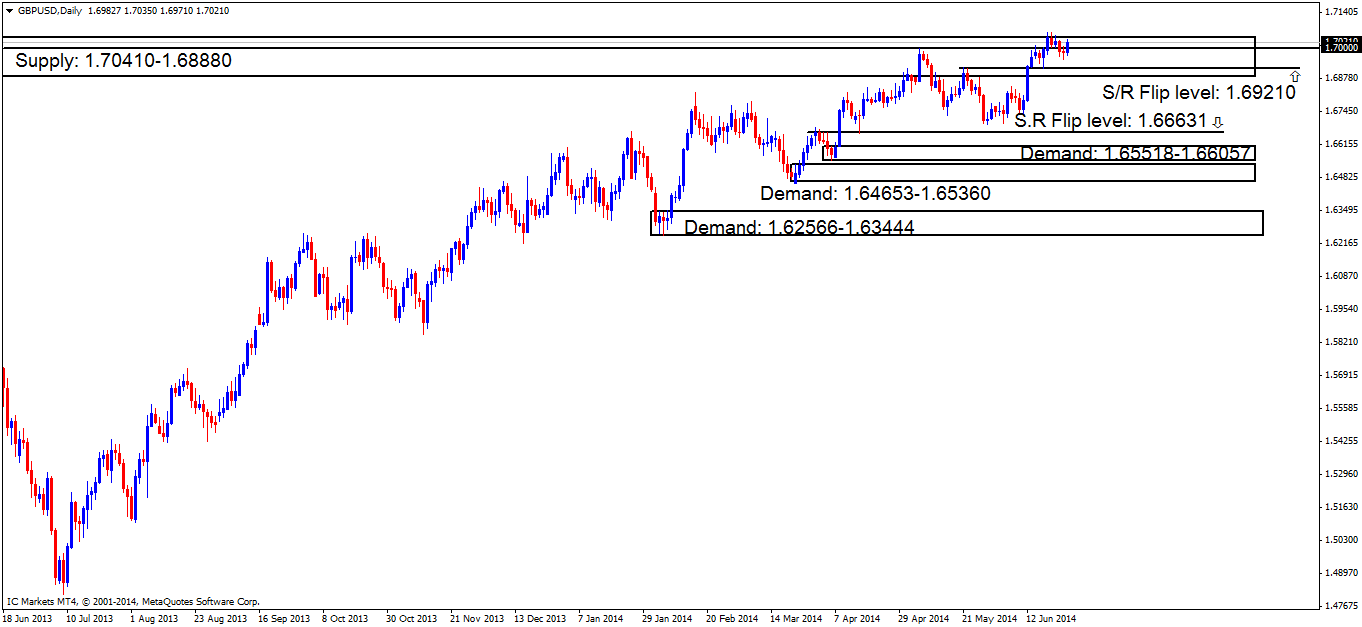
The sellers did not even make it to the first trouble area at the S/R flip level below (1.69210) before the buyers began showing interest, this does not look good for sellers at the moment, as a break above may well be seen with little stopping price from hitting the next fresh supply at 1.76290-1.73110 situated deep within the weekly supply mentioned above.
4hr TF.
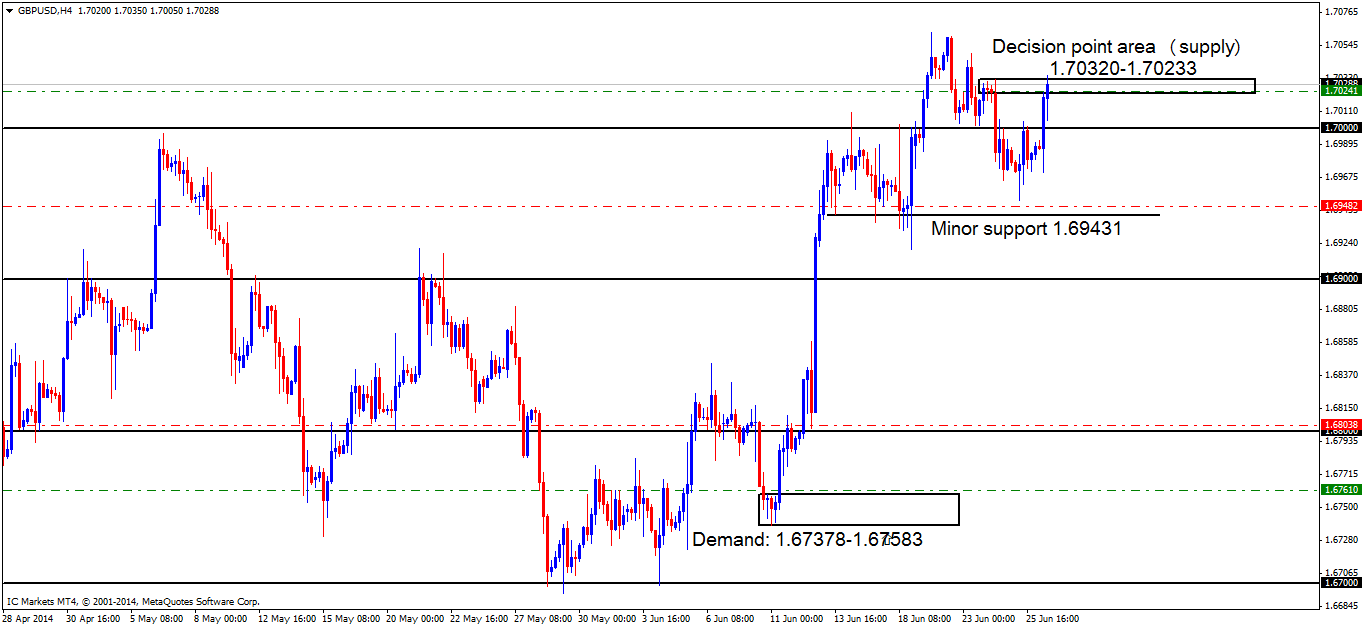
The buyers have recently been very active, a touch of the round number 1.70000 was seen, and a small bearish reaction followed, however it did not take long for the buyers to gather enough liquidity (sell orders to buy into) to break the round number with a nice-looking bullish candle. Price traded right into our decision point area (supply) at 1.70320-1.70233, where at the time of writing the sellers seem to be struggling against the current buying onslaught.
If price breaks above this supply area just mentioned, there is very little stopping price from advancing, history on this timeframe is not available back to where we require it, so we can only assume price will visit a higher timeframe supply area on the daily chart seen at 1.76290-1.73110.
Pending/P.A confirmation orders:
- Pending buy orders (Green line) are seen at 1.67610 just above demand at 1.67378-1.67583. A pending order is valid here due to the momentum away from the demand area, indicating orders may be left unfilled here.
- P.A confirmation buy orders (Red line) are seen just above the round number 1.68000 at 1.68038. A reaction may be likely here because of the way pro money used this level to rally prices higher with force, a quick change in direction like this likely indicates pro money activity, thus, all of their orders may have not been filled at that time. The reason a pending order is not used here is because pro money, on a regular basis perform deep stop hunts around big figure levels (1.68000), and these tails/wicks can be huge sometimes, hence the need to wait for confirmation.
- P.A confirmation buy orders (Red line) are seen just above minor support (1.69431) at 1.69482. A reaction north is likely to be seen here, however we are currently seeing higher-timeframe supply being hit on the weekly timeframe at 1.76290-1.70490, hence the need for a confirmation buy order, rather than a pending buy order.
- The pending sell order (Green line) set just within the decision point supply area (1.70320-1.70233) has been stopped out within a pip (at the time of writing).
- No P.A confirmation sell orders (Red line) are seen in the current market environment.
Quick Recap:
Buyers are becoming more active around weekly supply at 1.76290-1.70490, while on the daily timeframe, the first trouble area for the sellers (S/R flip level 1.69210) was not even hit before buyers came into the market. The 4hr timeframe shows buyers currently doing battle with sellers around a decision point area at 1.70320-1.70233 where our pending sell order was filled and then very shortly stopped out. If the buyers win here, price will likely be seeing much higher prices trading deeper into weekly supply (levels above).
- Areas to watch for buy orders: P.O: 1.67610 (SL: 1.67345 TP: [1] 1.68000 [2] 1.69000 [likely to be changed, depending on price approach]). P.A.C: 1.68038 (SL: Dependent on approaching price action after the level has been confirmed TP: Dependent on approaching price action after the level has been confirmed). 1.69482 (likely to be set at 1.69176 TP: Dependent on approaching price action after the level has been confirmed).
- Areas to watch for sell orders: P.O: 1.70241 (Stopped out) (SL: 1.70352 TP: [1] 1.70000, subject to change depending on how future price action unfolds) P.A.C: No P.A confirmation sell orders seen in the current market environment.
AUD/USD:
Daily TF.
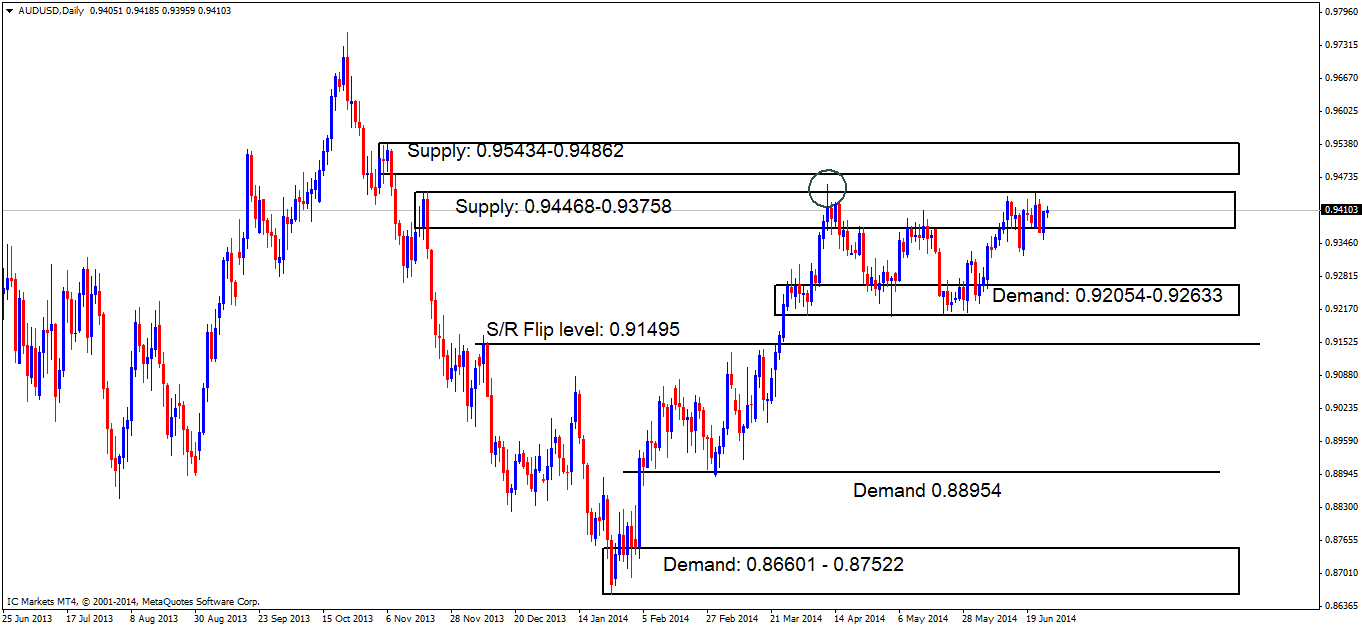
Indecisive price action is currently seen within daily supply at 0.94468-0.93758.
4hr TF.
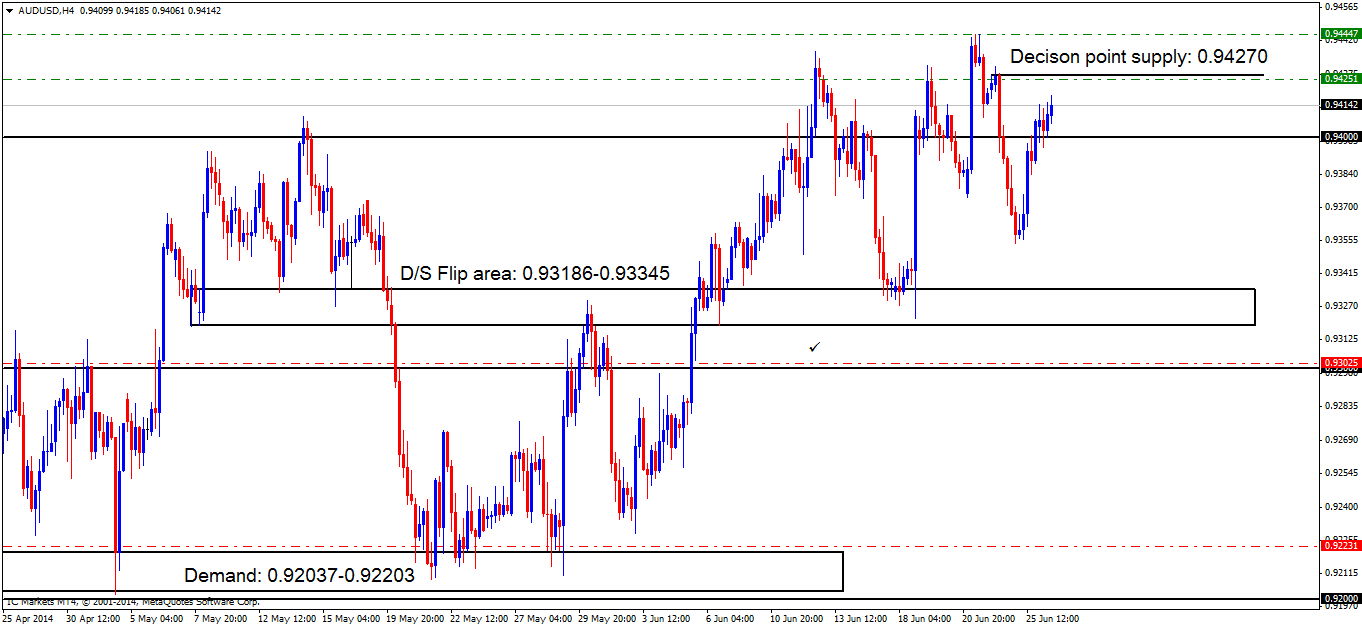
The buyers have recently taken over the market, a small bearish reaction at the round number 0.94000 was seen, but subsequently got broken, then retested for a possible advance north which is currently happening at the moment.
If buyers have the strength to continue, we will likely see our decision point supply at 0.94270 get hit, which will possibly push price down to at least the round number below at 0.94000.
Pending/P.A confirmation orders:
- No pending buy orders (Green line) are seen in the current market environment.
- P.A confirmation buy orders (Red line) are seen at 0.92231 just above demand at 0.92037-0.92203. It would be too risky to set a pending order around this area, since deep spikes into this demand zone have been seen (levels above) possibly consuming the majority of buyers in the process.
- P.A confirmation buy orders (Red line) are visible just above the round number 0.93000 at 0.93025. We require confirmation of this level because previous price action has warned us deep tests both north and south happen on a regular basis, hence the need to wait for confirmation rather than getting stopped out time after time through lack of patience.
- The pending sell order (Green line) set at 0.94447 around the high 0.94613 has seen the first target set at 0.93894 hit, with the second target being seen below at 0.93436.
- New Pending sell orders (Green line) are seen at a decision point supply area (0.94270) at 0.94251. The reason a pending sell order can be set here is because this is the last obvious decision made by pro money, where unfilled sell orders may still be lurking.
- No P.A confirmation sell orders (Red line) are seen in the current market environment.
Quick Recap:
The daily timeframe is showing indecisiveness within daily supply at 0.94468-0.93758, while on the 4hr timeframe active buyers are currently being seen. Price nearly hit our second target (0.93436) on our remaining short position above at 0.94447, but as we agreed, we were going to let price run. Price will likely push higher into our pending sell order seen at 0.92451 just below a decision point area at 0.94270 as this is the next fresh supply area currently being seen.
- Areas to watch for buy orders: P.O: No pending buy orders are seen with current price action. P.A.C: 0.92231 (SL: more than likely will be at 0.91984 TP: Dependent on approaching price action after the level has been confirmed) 0.93025 (SL: Dependent on approaching price action after the level has been confirmed TP: Dependent on approaching price action after the level has been confirmed).
- Areas to watch for sell orders: P.O: 0.94447 (Active – 1st target hit) (SL: 0.94667 TP: [1] 0.93894 [2] 0.93436) 0.94251 (SL: 0.94329 TP: [1] 0.94000 [2] 0.93671, but may be changed if any new developments are seen in the market). P.A.C: No P.A confirmation sell orders seen in the current market environment.
USD/JPY:
4hr TF.
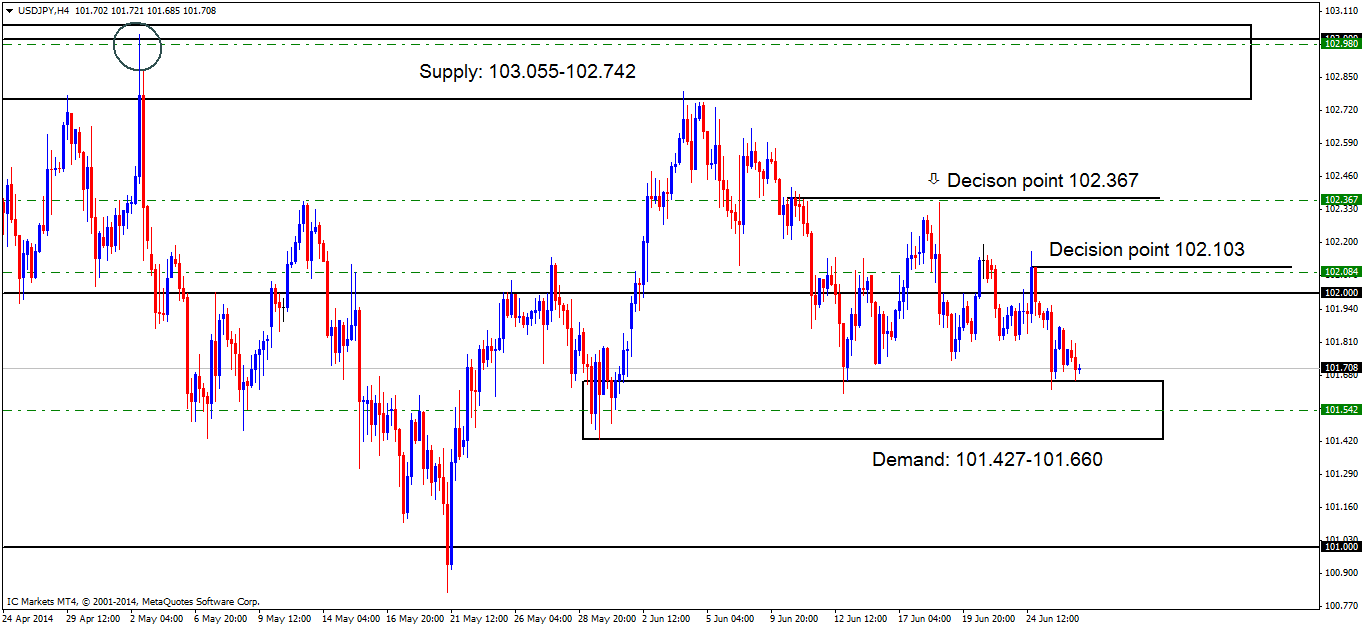
Chart one below shows price aggressively broke out of the triangle formation to the downside, consequently hitting demand below at 101.427-101.660 as reported may happen in the last analysis if a break south was seen.
Chart 1:
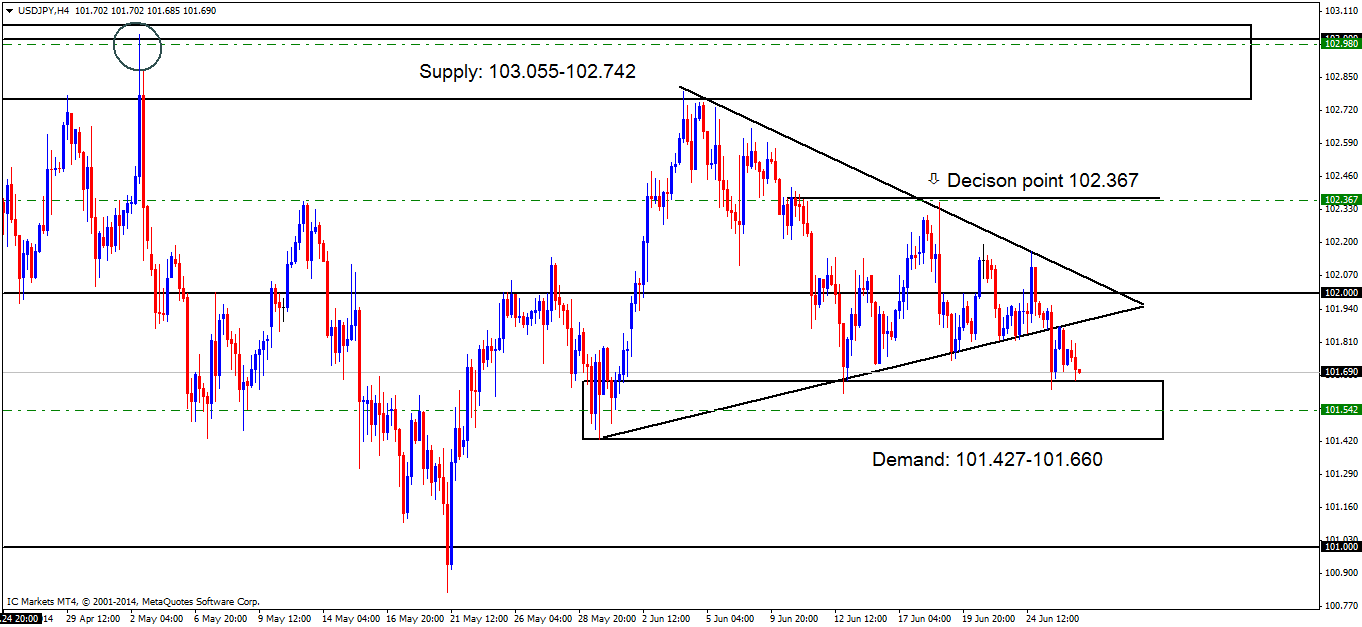
Chart two below shows a new decision point (supply) level has formed at 102.103, as the sellers have confirmed this area by consuming multiple lows below. Price will likely bounce in between supply just mentioned above (102.103) and demand below at 101.427-101.660 for most of today.
Higher timeframes show price will likely see 4hr demand holding, with 4hr supply above breaking first (levels above), as we are in higher timeframe demand (Weekly: 101.254 Daily: 101.532-100.787), but as always, expect the unexpected and remain vigilant to what the lower timeframe price action tells you!
Pending/P.A confirmation orders:
- Pending buy orders (Green line) are seen deeper within demand (101.427-101.660) at 101.542. A pending order is valid here since pro money are frequently seen testing deeper in confirmed demand areas such as this for active buyers.
- No P.A confirmation buy orders (red line) are seen in the current market environment.
- Pending sell orders (Green line) are visible at 102.980, deep within supply (103.055-102.742). This area may well appear to be weak now, but the way price reacted at the circled area within supply indicates pro money activity, meaning sell orders may be left unfilled there, so a pending sell order is permitted.
- Pending sell orders (Green line) are seen at 102.367. A pending order is valid here since this is the area where pro money made the ‘decision’ to break the low 102.113 and take prices lower into demand (101.427-101.660) meaning unfilled sell orders were likely left there in the process.
- New pending sell orders (Green line) are seen at a decision point (102.103) at 102.084. Pending sell orders are viable here due to this being an important decision point level where pro money decided to break multiple lows and visit demand below at 101.427-101.660, thus giving the impression unfilled sell orders may be left there as price did change direction very quickly.
- No P.A confirmation sell orders (Red line) are seen in the current market environment.
Chart 2:
Quick Recap:
The recent triangle formation spotted on the 4hr timeframe (chart one) saw a strong break south trading right into demand at 101.427-101.660. A new decision point level has formed, also on the 4hr timeframe, at 102.013 where we have set a pending sell order just below at 102.084. Price will likely break supply above (102.013) before breaking the demand area just mentioned, as the higher timeframes are currently trading around demand (Weekly: 101.254 Daily: 101.532-100.787).
- Areas to watch for buy orders: P.O: 101.542 (SL: 101.389 TP: 102.000 but may well change if the market sees any new developments) P.A.C: No P.A confirmation buy orders are seen in the current market environment.
- Areas to watch for sell orders: P.O: 102.980 (SL: 103.108 TP: 102.117, but may well change if the market sees any new developments) 102.367 (SL: 102.458 TP: Dependent on how price action approaches this area) 102.084 (SL: 102.184 TP: Dependent on how price approaches this area) P.A.C: No P.A confirmation sell orders are seen in the current market environment.
EUR/GBP:
Daily TF.
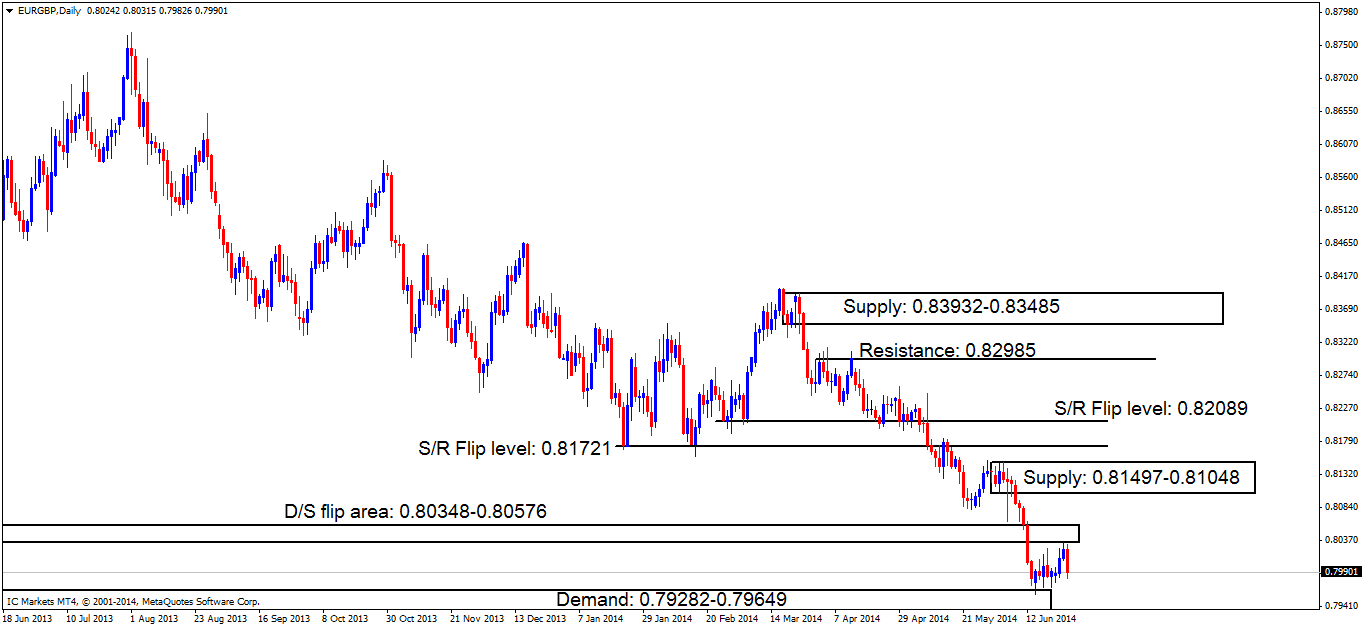
A beautiful to-the-pip reaction has been seen off the daily D/S flip area (supply) at 0.80348-0.80576, the first trouble area for sellers is demand below at 0.79282-0.79649.
4hr TF.
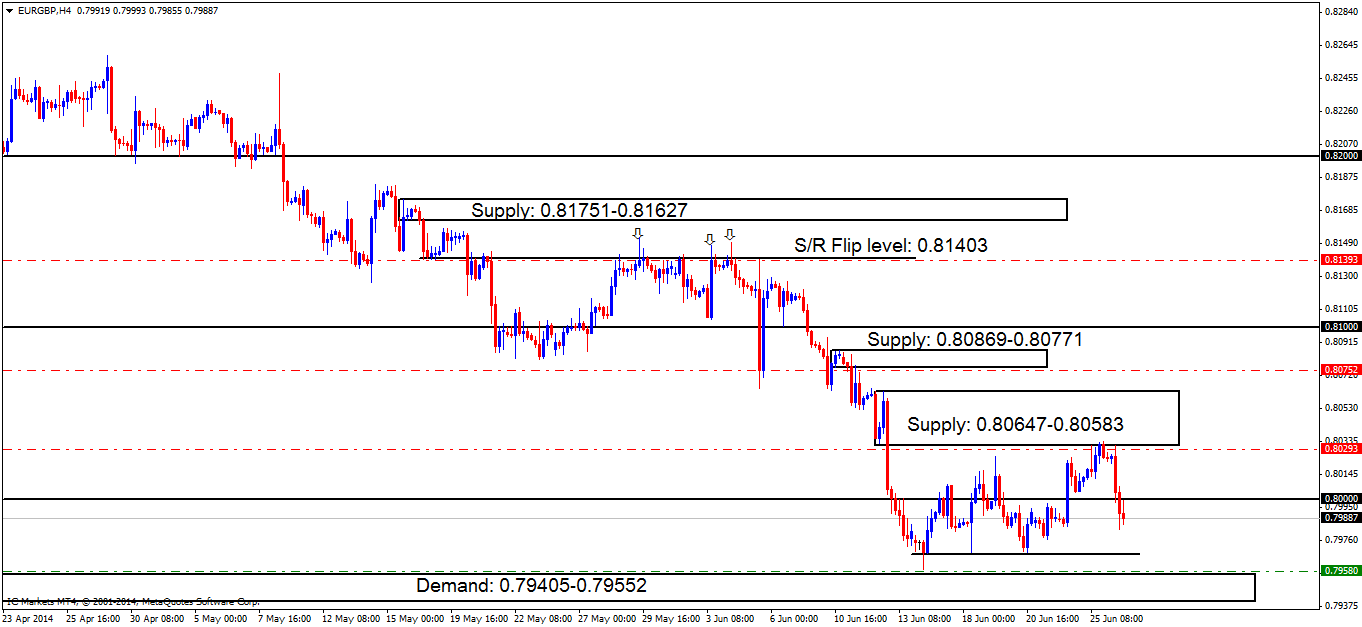
It was reported in the last analysis that Supply at 0.80647-0.80583 has been hit; this supply area is quite a risky level to go short off of due to the weekly timeframe showing price trading within weekly demand at 0.79596-0.80299. Even though this statement is still true, strong selling from the supply area mentioned above is being seen, however this could be short lived, so do be prepared for that. If we see a positive break below demand at 0.79405-0.79552 however, we can then begin looking for shorting opportunities if this does indeed happen.
Pending/P.A confirmation orders:
- A pending buy order (Green line) has been set at 0.79580 just above demand at 0.79405-0.79552. The rationale behind this is because buyers have likely consumed the majority of the sellers lurking around the round number 0.80000 and supply above at 0.80647-0.80583 likely clearing the path for higher prices. A small retracement will possibly be seen to collect more buyers for a rally higher, thus triggering our pending buy order.
- No P.A confirmation buy orders (Red line) are seen in the current market environment.
- No pending sell orders (Green line) are seen in the current market environment.
- P.A confirmation sell orders (Red line) under the S/R flip level 0.81403 at 0.81393 is an area where a reaction is likely, however there were too many wicks north seen marked with arrows, indicating sellers are drying up, thus, the need to wait for more confirmation.
- P.A confirmation sell orders (Red line) are seen just under supply (0.80869-0.80771) at 0.80752. Confirmation orders were used here because price is trading around a weekly demand area (0.79596-0.80299), which means price could easily consume this supply level as the higher timeframes usually overrule the lower timeframes.
- P.A confirmation sell orders (Red line) are seen just below supply (0.80647-0.80583) at 0.80293 is now active. Considering the higher-timeframe location seen on the weekly chart (Weekly demand: 0.79596-0.80299) , the sellers will need to consume the majority of the buyers around the 4hr demand area below at 0.79405-0.79552; a pending sell order can then be set awaiting a possible retracement.
Quick Recap:
The daily timeframe currently shows price reacting off of supply (D/S flip area) at 0.80348-0.80576, while on the 4hr timeframe we can see price has reacted well to supply at 0.80647-0.80583, which triggered our P.A confirmation sell order at 0.80293 in the process. This selling pressure will not likely make it past 4hr demand at 0.79405.0.79552 ( where we currently have a pending buy order set at 0.79580) due to price currently being seen trading within weekly demand at 0.79596-0.80299.
- Areas to watch for buy orders: P.O: 0.79580 (SL: 0.79368 TP: [1] 0.80000 [2] 0.80583 [May change if any new developments in the market are seen]) P.A.C: No P.A confirmation buy orders are seen in the current market environment.
- Areas to watch for sell orders: P.O: No pending sell orders are seen in the current market environment. P.A.C: 0.81393 (SL: Will be likely set at 0.81564 TP: Will be likely set at the round number 0.81000) 0.80752 (SL: likely to be set at 0.80900 TP: Dependent on where price ‘confirms’ the level) 0.80293 (Active-awaiting confirmation) (SL: likely to be set at 0.80648 TP: Dependent on where price ‘confirms’ the level).
USD/CAD:
Weekly TF.
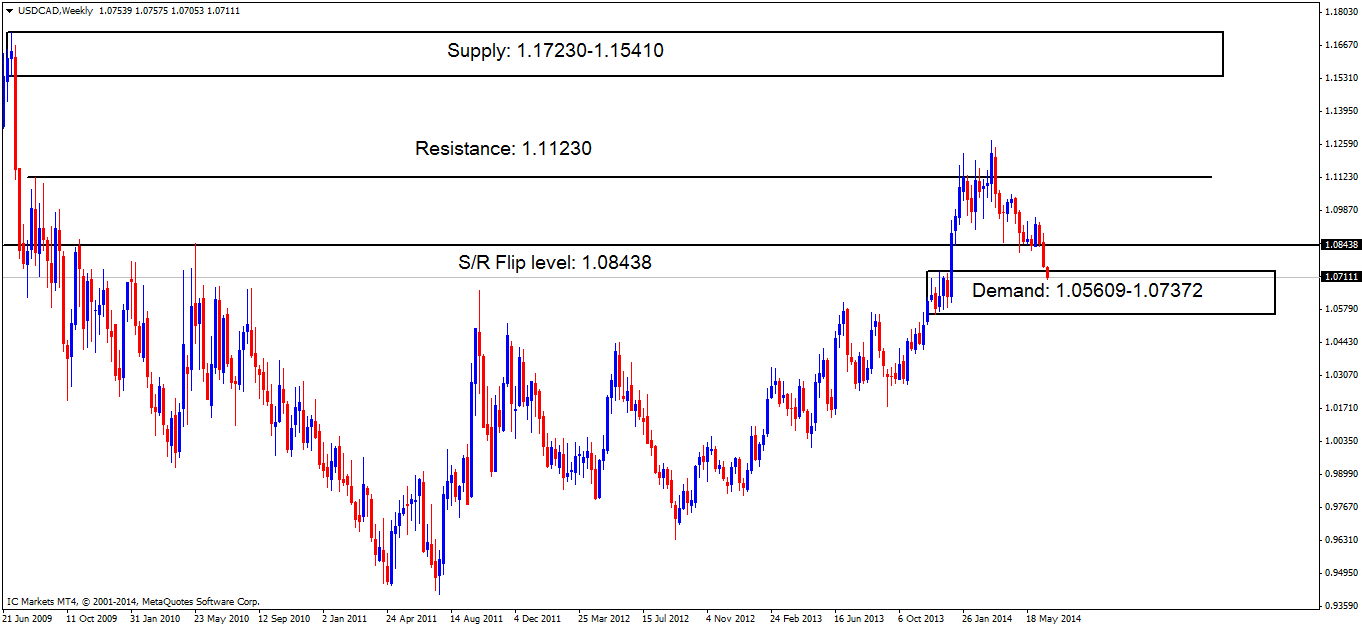
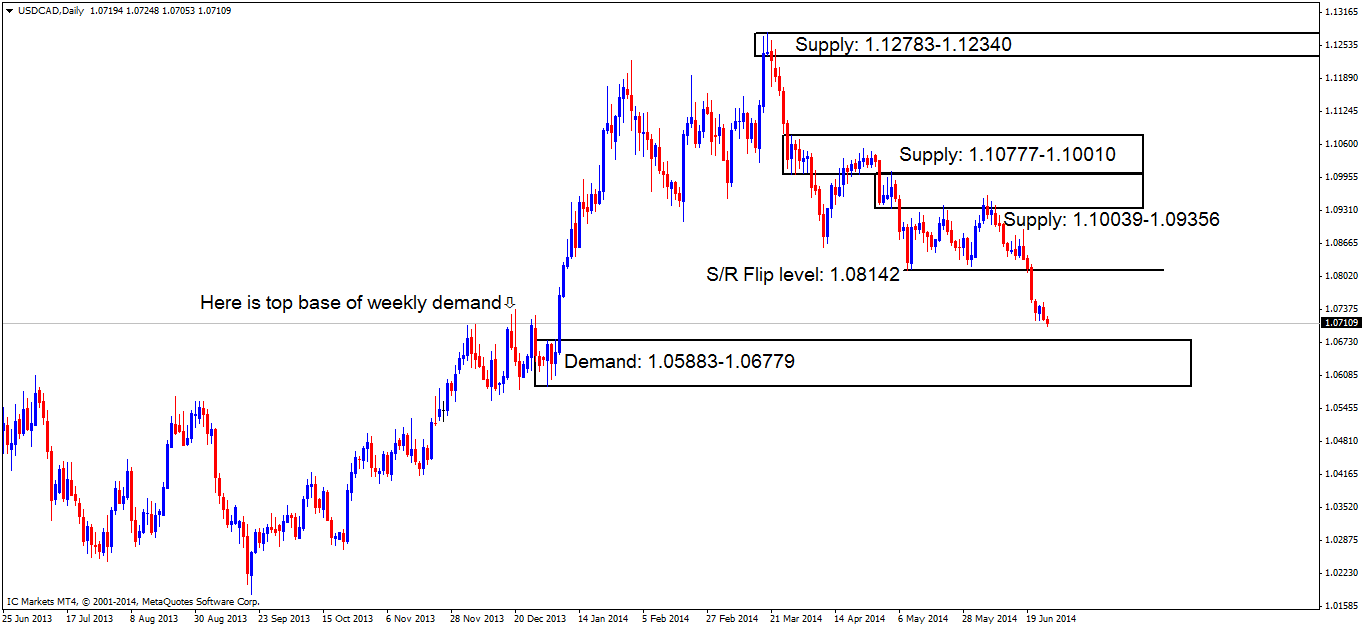
The first reaction we saw around weekly demand at 1.05609-1.07372 looked relatively bullish, however price has taken a dive south heading deeper into this demand area (levels above).
Daily TF.
It appears from the daily timeframe, that pro money may want to move price deeper into weekly demand (see above) to daily demand at 1.05883-1.06779 as there is very little stopping price from doing this.
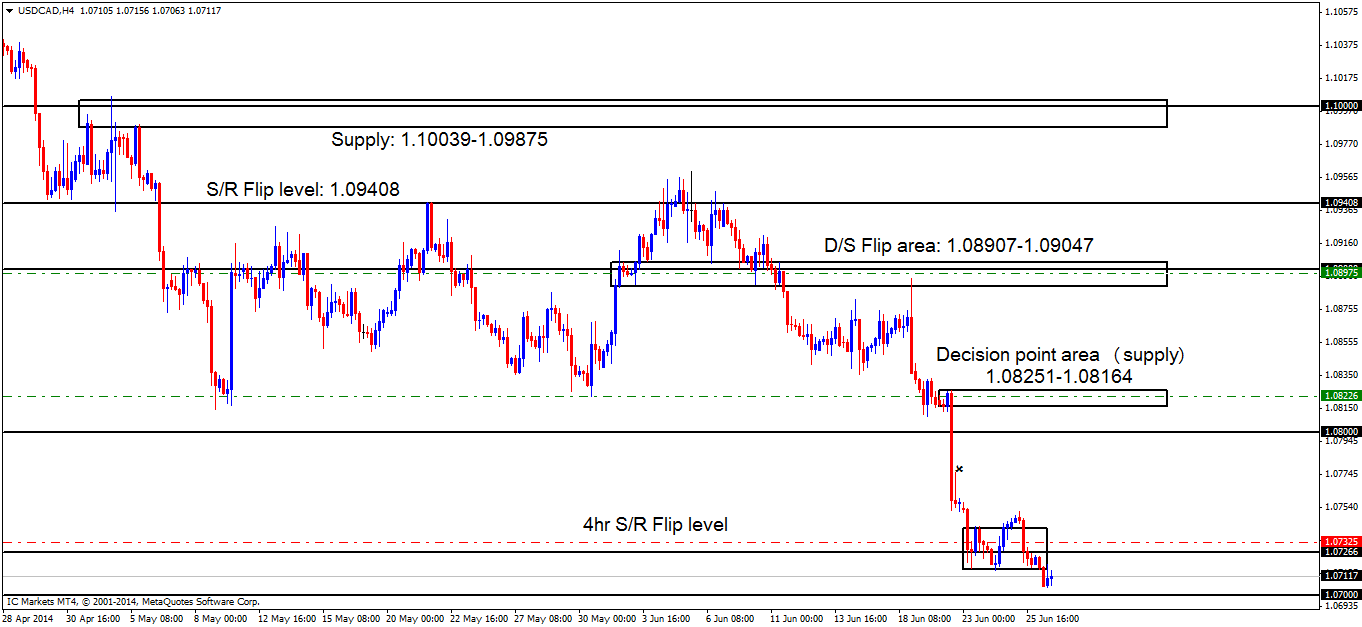
4hr TF.
Chart one below shows a breakout north of the consolidating price action as explained in yesterday’s analysis. Price then was seen selling quite heavily, consuming any lower timeframe buyers attempting to play the lower limits of this consolidating price action, while nearly hitting the round number below at 1.07000.
Chart 1:
Pending/P.A confirmation orders:
- No pending buy orders (Green line) are seen in the current market environment.
- The P.A confirmation buy order (Red line) set just above the S/R flip level (1.07266) at 1.07325 has now been cancelled. Price dropped too far from the entry level, and the buyers were unable to consume any of the sellers around the high 1.07759 marked with an x (chart 1).
- Pending sell orders (Green line) are seen at 1.08975, within supply (1.08907-1.09047) just below the round number 1.09000. A pending sell order is permitted to be set here since the sellers confirmed this area from the previous confirmation sell order that was originally set at 1.08876 by consuming the majority of the buyers situated in and around (which was) demand at 1.08142-1.08330 (Seen on Thursday 19th June daily analysis).
- Pending sell orders (Green line) are seen within the decision point supply area (1.08251-1.08164) at 1.08226. Pending orders are valid here due this likely being the work of pro money, the momentum out of the zone is only caused by traders with big accounts, and when pro money move the market, all of their orders here were unlikely to have been filled, hence a pending order being logical here.
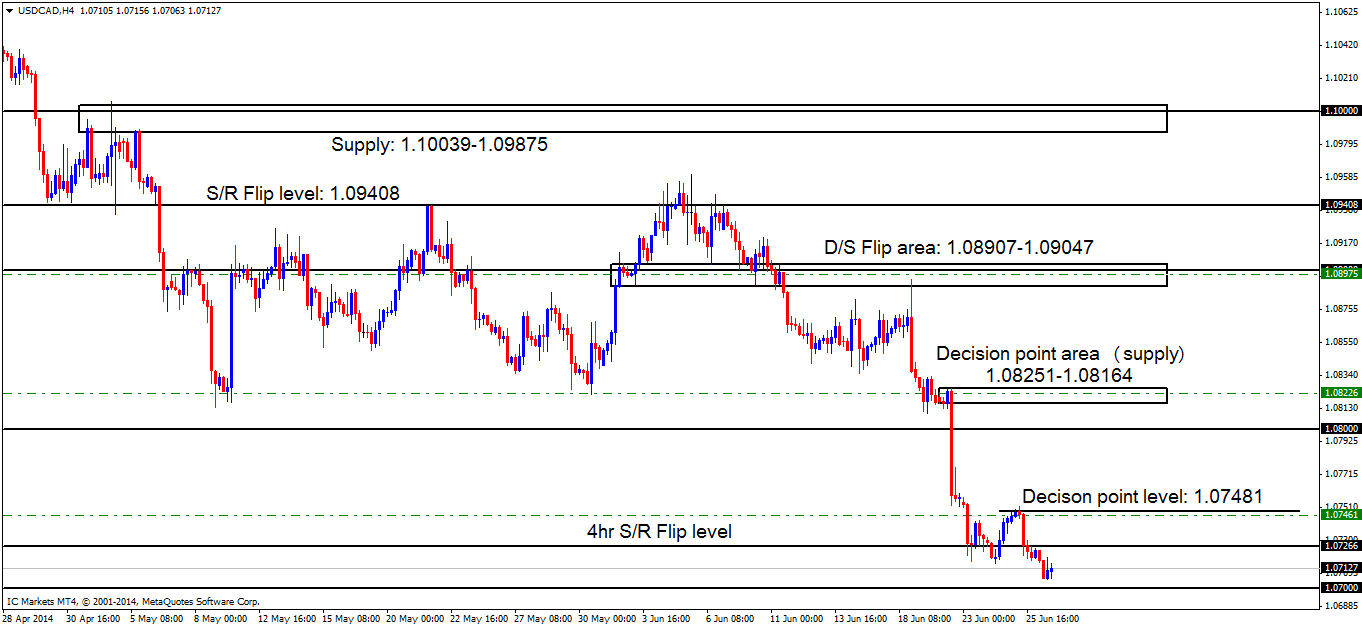
- New pending sell orders (Green line) are seen around the decision point level (1.07481) at 1.07461. A pending sell order is valid here due to this being the last ‘obvious’ decision made by pro money that consumed buyers around the S/R flip level at 1.07266, unfilled sell orders may have been left here in the process.
- No P.A confirmation sell orders (Red line) are seen in the current market environment.
Chart two below shows a new decision point area has formed. Now, some would say one would be crazy to sell into weekly demand, right? In most cases this would be correct. However, remember above on the daily timeframe, it shows price has room to move south possibly into daily demand at 1.05883-1.06779. To do this pro money requires liquidity (buy orders to sell into), and the newly-formed decision point mentioned above may well be the perfect place to help facilitate this.
Price will likely see a bullish reaction off of the round number 1.07000, then rally up to the decision point area (level above) for an overall bigger push south.
Chart 2:
Quick Recap:
The weekly timeframe shows sellers pushing deeper into weekly demand at 1.05609-1.07372, while the daily timeframe shows little is stopping price from dropping further south towards daily demand at 1.05883-1.06779. Our P.A confirmation buy order on the 4hr timeframe set at 1.07325 around the S/R flip level (1.07266) did not work out. A new decision point level has formed at 1.07481 where we have a pending sell order set at 1.07461 as we believe price may retrace back to this level before continuing south to daily demand (levels above).
- Areas to watch for buy orders: P.O: There are no pending buy orders seen within the current market environment. P.A.C: 1.07325 (Has been cancelled) SL: likely to be set at 1.07152 TP: Dependent on approaching price action after the level has been confirmed).
- Areas to watch for sell orders: P.O:1.08975 (SL: 1.09059 TP: 1.08330 [May change if any new developments in the market are seen]) 1.08226 (SL: 1.08357 TP: Dependent on approaching price action) 1.07461 (SL: 1.07550 TP: Dependent on how price approaches this level). P.A.C: There are no P.A confirmation sell orders seen within the current market environment.
USD/CHF:
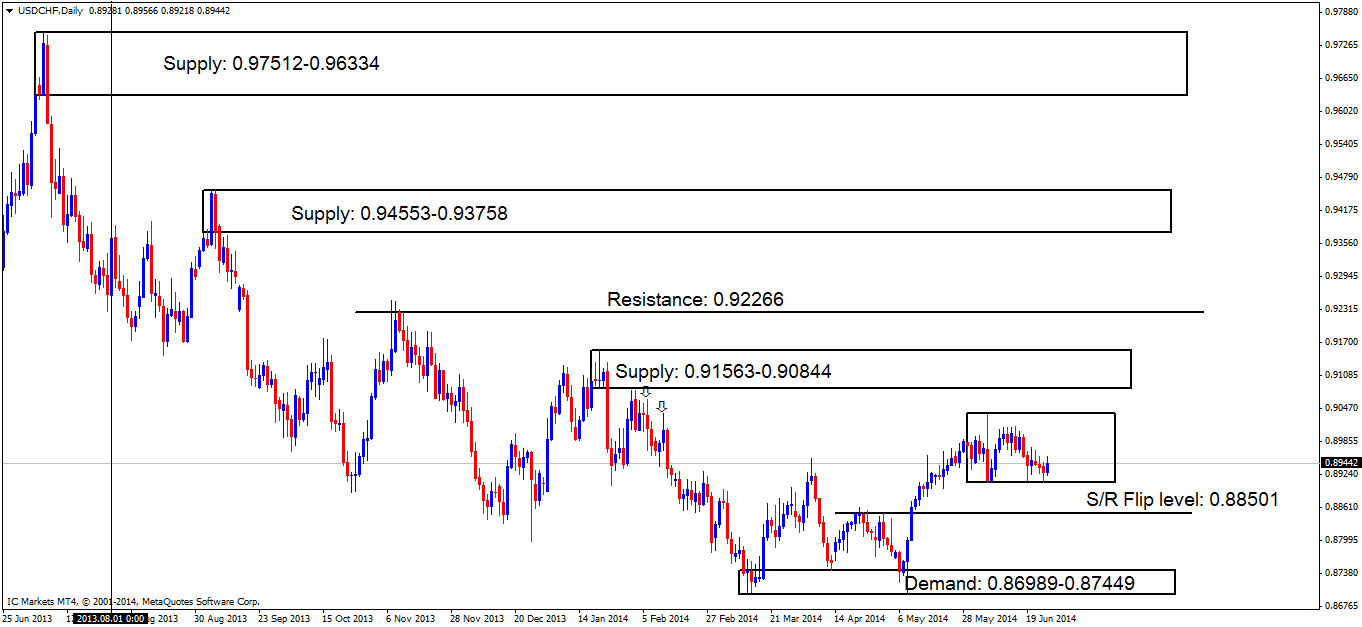
Daily TF.
Price appears to be forming a range with the highs being seen at 0.90367 and the lows at 0.89081. A break below this range would likely see price testing the S/R flip level just below at 0.88501, conversely, a break above the range would likely see price testing supply at 0.91563-0.90844.
4hr TF.
Cleary there were buyers left around the demand area at 0.88973-0.89168, as it was reported in the last analysis that this demand area appears weak due to the amount of touches it has seen, so a break south is very likely at the moment.
As one can see, this pair is being difficult, clear price action is presently not being shown other than price remaining capped between the low of the mini range above at 0.89643 acting as temporary resistance, and demand below at 0.88973-0.89168.
A break below the demand area just mentioned would see price likely testing demand below at 0.88656-0.88816, likewise a break above supply would likely force price to test supply once again at 0.90381-0.90033.
Pending/P.A confirmation orders:
- No pending buy orders (Green line) are seen in the current market environment.
- P.A confirmation buy orders (Red line) are seen just above the daily S/R flip level (0.88501) at 0.88533. This level needs to see some confirming price action before any entry is placed in the market, due to their being no logical area for a stop loss order.
- Near-term P.A confirmation buy orders (Red line) are seen within demand (0.88973-0.89168) at 0.89029, just above the round number 0.89000, as price may retrace to demand to collect unfilled orders deeper within this area.
- The pending sell order (Green line) visible at the base of supply (0.90381-0.90033) just above the round number 0.90000 at 0.90063 still remains active. The first target has been hit at 0.89168, we have closed most of our final position now, allowing a very small position to run, giving price room to move, and hopefully hit our final target at the daily S/R flip level (0.88501).
- No P.A confirmation sell orders (Red line) are seen in the current market environment.
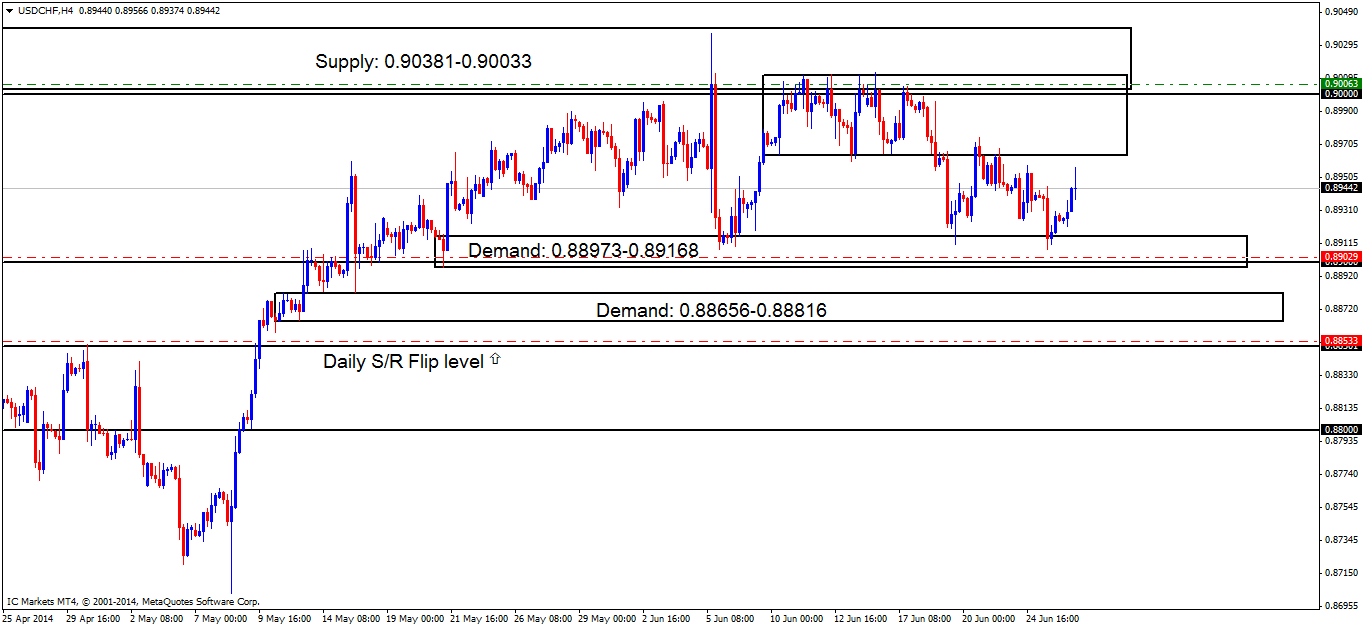
Quick Recap:
The daily timeframe currently shows a range forming (0.90367/0.89081), while on the 4hr timeframe price remains capped between the low of the mini range above at 0.89643 acting as temporary resistance, and demand below at 0.88973-0.89168. It is very difficult to give a likely scenario here with the current price action offered, this is the reason we have closed 90% of our sell position now from 0.90063, so our best bet is to wait until a break of either 4hr supply or demand (levels above) happens.
- Areas to watch for buy orders: P.O: There are no pending buy orders seen in the current market environment. P.A.C: 0.88533 (SL: Dependent on approaching price action after the level has been confirmed TP: Dependent on approaching price action after the level has been confirmed) 0.89029 (SL: likely to be set at 0.88784 TP: Dependent on approaching price action after the level has been confirmed).
- Areas to watch for sell orders: P.O: (Active – 1st target hit) 0.90063 (SL: 0.90412 TP: [1] 0.89168 [2] 0.88501) P.A.C: There are currently no P.A confirmation sell orders seen in the current market environment).
XAU/USD (GOLD)
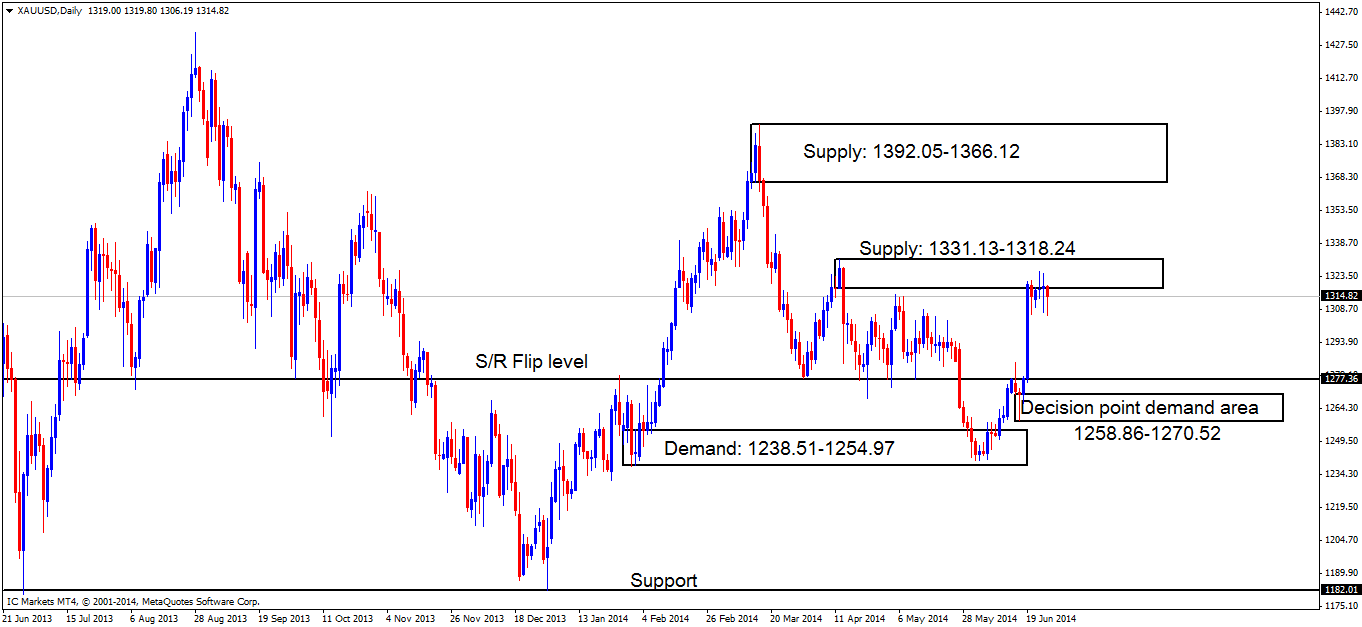
Daily TF.
It is getting messy around daily supply at 1331.13-1318.24; there are wicks and tails in all directions, with either side yet to be seen taking charge.
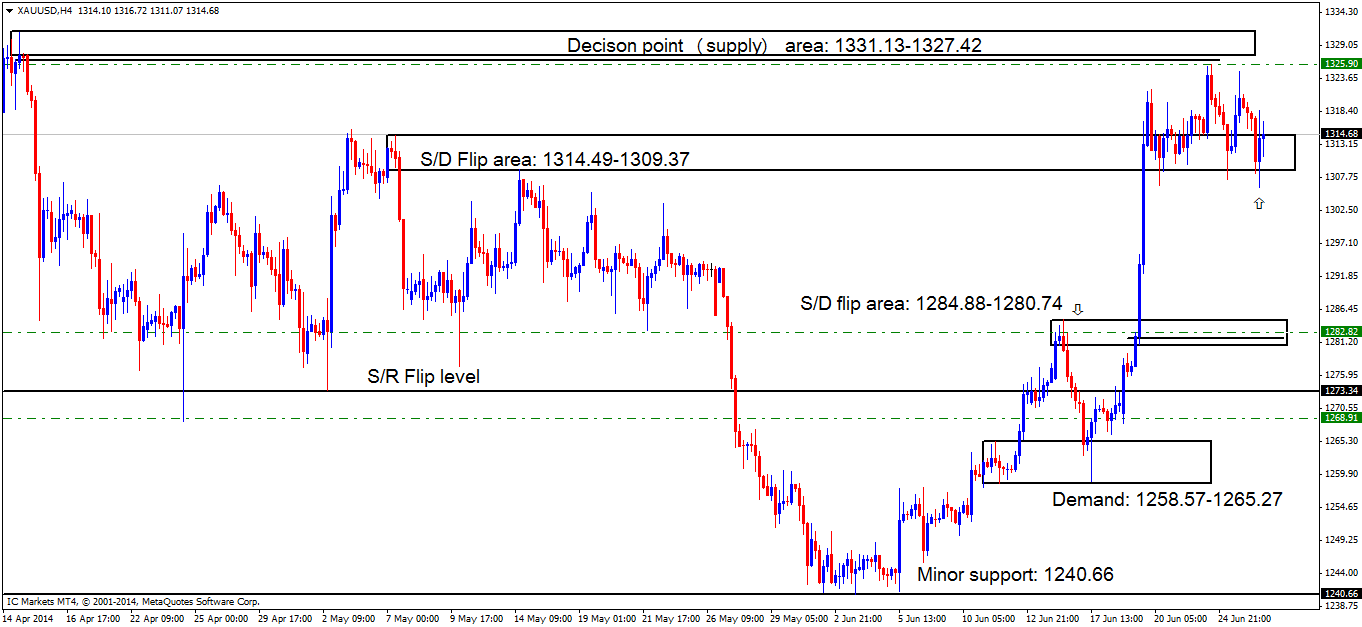
4hr TF.
Other than a deeper tail being seen below the S/D flip area at 1314.49-1309.37 marked with an arrow, not a lot has changed. Price still remains capped between the demand area just mentioned and supply above at 1331.13-1327.42.
A snippet from yesterday’s analysis which remains valid at the time of writing:
A further rally up into supply at 1331.13-1327.42 is likely to happen as pro money may not have enough liquidity to drop price all the way to the next demand area which is currently seen below at 1284.88-1280.74. If price were to break above this supply area just mentioned, we would likely see a test of oncoming supply at 1342.46-1337.02 which could in fact help facilitate a nice fakeout of the daily supply area at 1331.13-1318.24 mentioned above, but only time will tell.
Overall, we still favour shorts as we are in higher-timeframe supply (levels above).
Pending/P.A confirmation orders:
- Pending buy orders (Green line) are seen within demand (S/D flip area… 1284.88-1280.74) at 1282.82. We have set a pending buy order here due to the fact there was a decision made here (marked by the black horizontal level, when decisions are made by pro money, they may be unfilled buy orders left there, hence the fact we have set our pending order there.
- Pending buy orders (Green line) are seen just above demand (1258.57-1265.27) at 1268.91. We are permitted to set a pending buy order here as the buyers have consumed sellers within (which was at the time of writing) supply at 1293.47-1285.52, as per the previous confirmation buy order originally set at 1266.00 (See Thursday 19th June for details).
- No P.A confirmation buy orders (Red line) are seen in the current market environment.
- Pending sell orders (Green line) are seen just below the supply/decision point (1331.13-1327.42) at 1325.90. A pending sell order was set here because this area is deep within daily supply (1331.13-1318.24) and the momentum away from the area indicates unfilled orders may well be left there.
- No P.A confirmation sell orders (Red line) are seen in the current market environment.
Quick Recap:
Other than price nearly filling our pending sell order at 1235.90, nothing has changed and remains exactly the same as the last analysis:
The daily timeframe shows sellers are currently struggling around daily supply at 1331.13-1318.24, while on the 4hr timeframe a decision needs to be made. Price will either have to consume and break supply at 1331.13-1327.42, or consume and break demand below at 1314.49-1309.37.
We however, favor the latter, because we are presently trading in and around in higher-timeframe daily supply (levels above) If this does indeed happen, our pending sell order set at 1325.90 may well be filled as pro money may perform a deeper test of supply above at 1331.13-1327.42 to help fill the liquidity requirements (buy orders to sell into) for the overall sell off.
- Areas to watch for buy orders: P.O: 1268.91 (SL: 1264.30 TP: Dependent on approaching price action) 1282.82 (SL: 1275.12 TP: Dependent on approaching price action). P.A.C: There are currently no P.A confirmation buy orders seen in the current market environment.
- Areas to watch for sell orders: P.O: 1325.90 (SL: 1332.71 TP: Dependent on approaching price action). P.A.C: There are currently no P.A confirmation sell orders seen in the current market environment.
Source: ICMarkets Trading Desk


