
Previous Story
GBP/USD analysis for July 26, 2017
Posted On 26 Jul 2017
Comment: 0
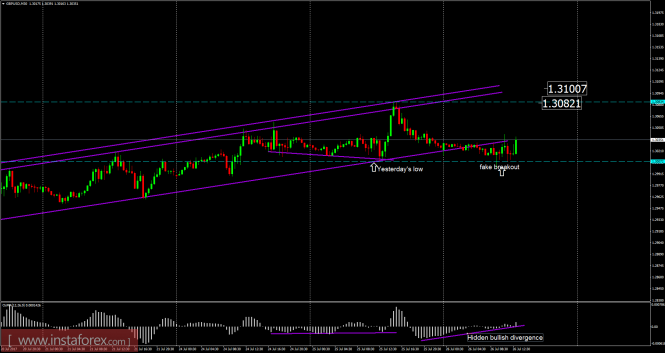
Recently, the GBP/USD has been trading downwards. The price tested the level of 1.2999. According to the 30M time frame, I found a fake breakout of yesterday’s low at the price of 1.3007, which is a sign that selling looks risky. There is a hidden bullish divergence on the moving average oscillator, which is another sign of strength. My advice is to watch for potential buying opportunities. The upward targets are set at the price of 1.3080 and 1.3100.
Resistance levels:
R1: 1.3070
R2: 1.3115
R3: 1.3145
Support levels:
S1: 1.3000
S2: 1.2970
S3: 1.2925
Trading recommendations for today: watch for potential buying opportunities.
The material has been provided by InstaForex Company – www.instaforex.com
Source:: GBP/USD analysis for July 26, 2017


