
Previous Story
Ichimoku cloud indicator analysis of gold for February 27, 2018
Posted On 27 Feb 2018
Comment: 0
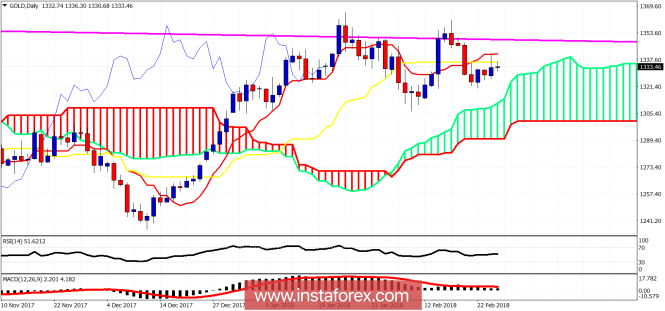
Gold price got rejected at the $1,342 level yesterday and pulled back towards the short-term $1,330 support by the kijun-sen. Price remains below the Ichimoku cloud in the short-term, implying trend remains bearish, as price could not break above the cloud.
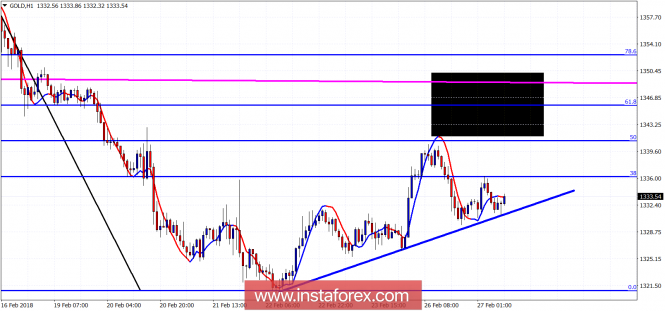
Blue line – support trend line
Black rectangle – resistance area
Gold price reached the 50% Fibonacci retracement and pulled back. However price continues making higher highs and higher lows in the 1 hour chart as shown above, holding also above the blue trend line support. Next important resistance area is at $1,343-50. If bulls manage to break above that area then we could see a run towards $1,400.
Magenta line – long-term resistance
Yesterday price got rejected at the Daily tenkan-sen indicator and price closed below the kijun-sen. This is not a good sign for bulls. Key short-term support is at $1,320. A break below it could push price lower towards $1,305. Daily clous support is at $1,300-$1,305. As long as this holds bulls have hopes for another run towards the important long-term resistance of $1,350-60.
The material has been provided by InstaForex Company – www.instaforex.com
Source:: Ichimoku cloud indicator analysis of gold for February 27, 2018


