
Previous Story
Ichimoku cloud indicator analysis of USD/CAD for May 17, 2018
Posted On 17 May 2018
Comment: 0
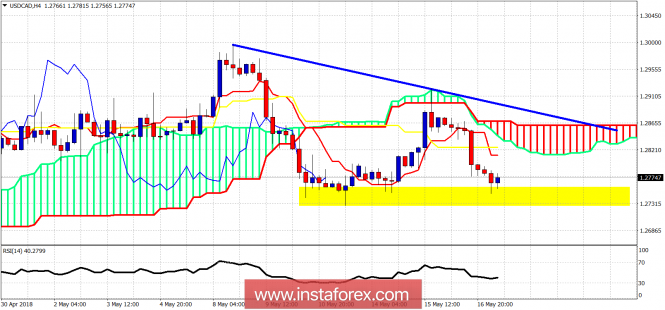
The USD/CAD is in a bearish trend making lower lows and lower highs. Price is trading below the Ichimoku cloud and recently got rejected when it tried to bounce towards 1.2930. I’m bearish USD/CAD specially if we break below 1.2730.
Blue line – resistance trend line
Yellow rectangle – support area
The USD/CAD pair is trading below the 4-hour cloud. However we have critical short-term support at 1.2730-1.2750. A break below this area will open the way for a move lower towards 1.2650. Bulls need to see a bounce from this area and a break above the short-term resistance of 1.2830. Cloud resistance is at 1.2830 until 1.2870. Breaking above the blue trend line and above the cloud are the signs bulls want to see in order to control the trend. Until then bears are under control of the trend and I remain bearish.
The material has been provided by InstaForex Company – www.instaforex.com
Source:: Ichimoku cloud indicator analysis of USD/CAD for May 17, 2018


