
Previous Story
Ichimoku indicator analysis of gold for September 5, 2017
Posted On 05 Sep 2017
Comment: 0
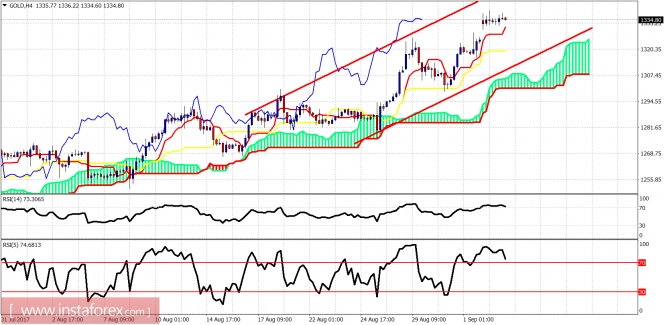
Gold price is moving sideways in the intraday chart. Medium and longer-term trend remains bullish and we continue to see a move above $1,400 over the coming months. However there are increased chances of a Gold pullback over the next 1-2 weeks towards $1,300.
Red lines – bullish channel
In the short term, price is clearly bullish. There are some topping signs by the oscillators that provide a short-term warning for bulls. We could see a 10-30$ decline soon. Support is at $1.331 and the next at $1,320.
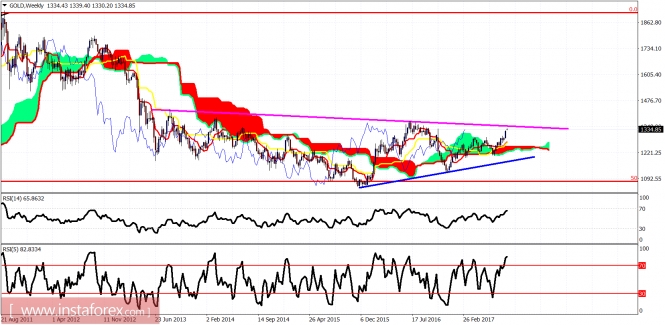
Magenta line – resistance
Blue line – support
On a weekly basis, we are in a bullish break out above the weekly Kumo. Technical resistance is at $1,350 by the magenta trend line. I expect the Gold price to reach and most probably break the resistance trend line. I do not expect price to move back below the weekly Kumo, although a pullback is possible. I do not trade pullbacks, pullbacks are buying opportunities.
The material has been provided by InstaForex Company – www.instaforex.com
Source:: Ichimoku indicator analysis of gold for September 5, 2017


