
Previous Story
Ichimoku indicator analysis of USDX for August 18, 2017
Posted On 18 Aug 2017
Comment: 0
The Dollar index remains in a bullish short-term trend. Price is making higher highs and higher lows. However, the momentum is not as strong as we expected and this could imply that another strong downward move towards 91 could come soon.
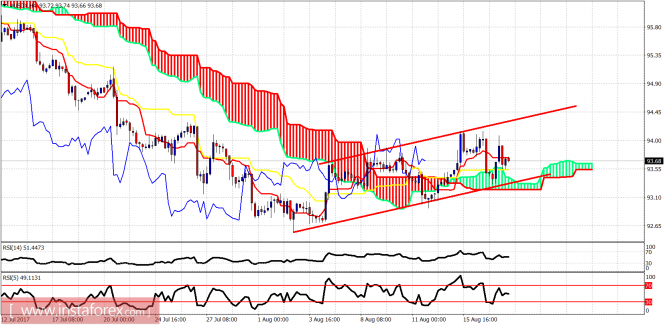
Red lines – bullish channel
The price is trading above the 4 hour Kumo (cloud). Price is also inside the bullish red channel. Support is at 93.30 while resistance is at 94.30. The form of the rise is corrective in nature. Once support fails to hold on the 4-hour chart, we should expect heavy selling to push the index to new monthly lows.
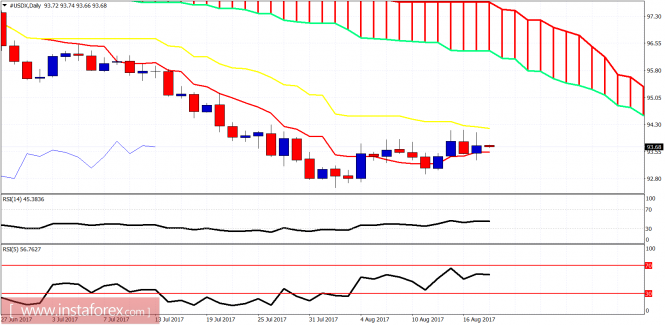
On a daily basis, the price is trapped between the kijun- and the tenkan-sen indicators. The trend is still however bearish and for that, to change we would need a push above 97.30. However, a break above 94.20-94.30 will open the way for a push towards 96.The material has been provided by InstaForex Company – www.instaforex.com
Source:: Ichimoku indicator analysis of USDX for August 18, 2017


