
Previous Story
Ichimoku indicator analysis of USDX for May 15, 2017
Posted On 15 May 2017
Comment: 0
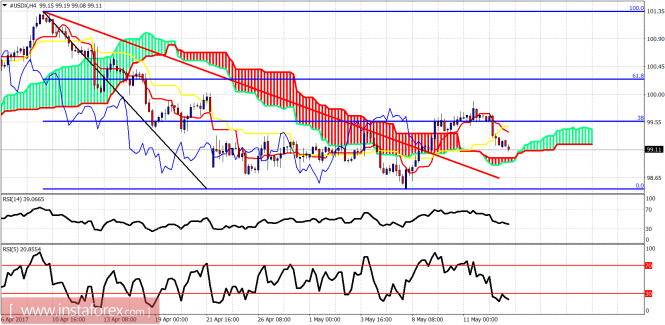
The Dollar index is following our path. Price bounced off the 98.60 area and found resistance and got rejected at 99.60 area. Our first target for a pullback was at the 99 level where we are right now. If the Dollar index is to reverse upwards, it needs to do it early this week and not move much lower.
Red line – resistance (broken)
The Dollar index is still trading above the Ichimoku cloud on the 4-hour chart and is now testing important short-term support. The Dollar index should bounce from current levels, otherwise we should expect the test of May lows and why not break below them as last week we did not manage to close above weekly support.
Red line – resistance
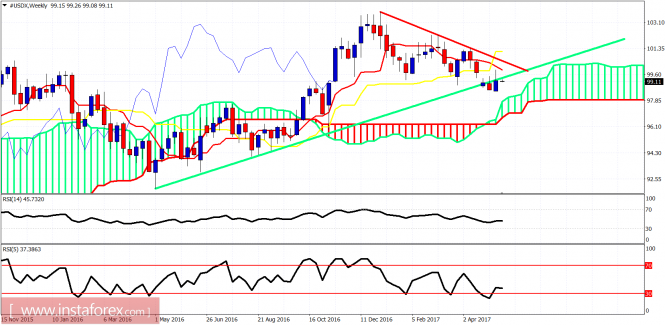
Green line – long-term support
The Dollar index weekly candle of last week did not manage to close above the long-term green trend line support. Price is now trading below the trend line which is now resistance. The most important however resistance is the downward sloping red trend line at 100.50. Weekly support is now at 98 where the Kumo (cloud) is found.
The material has been provided by InstaForex Company – www.instaforex.com
Source:: Ichimoku indicator analysis of USDX for May 15, 2017


