
Previous Story
Ichimoku indicator analysis of USDX for May 16, 2017
Posted On 16 May 2017
Comment: 0
The US dollar index did not bounce yesterday and broke through the support. The last chance for dollar bulls is to make a double bottom at 98 and then bounce. The weekly trend line is broken and dollar bulls need to show more strength if they want the trend to reverse to the upside.
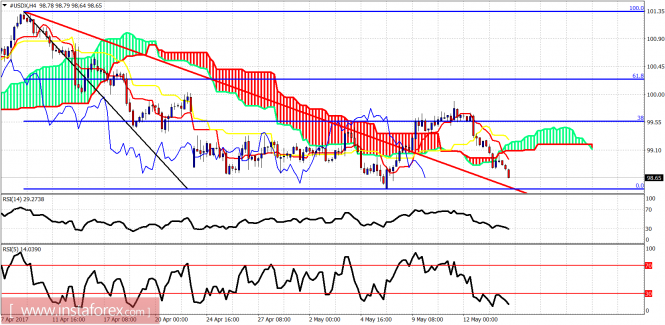
Red line – resistance (broken)
The dollar index has broken below the 4 hour cloud. The price could be back testing the red trend line resistance that was broken. Support lies at the May lows at 98.48 and we could see a double bottom here. If the support fails to be broken, we should expect 98 to be tested and most probably broken.
Red line – resistance
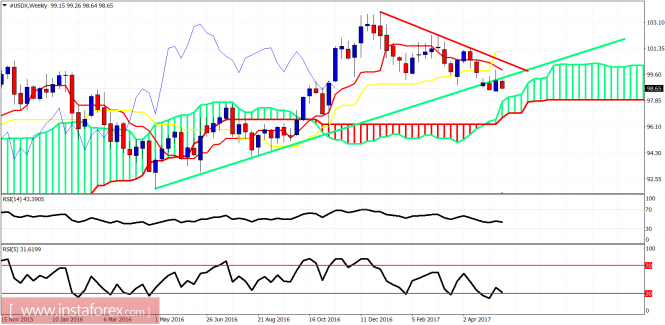
Green line – long-term support trend line
The Dollar index broke below and back-tested the green trend line resistance. Price tried to move above it again but got rejected. USDX may move towards the weekly Kumo support at 97.80-97.50. This is my next target from where we could see a considerable bounce in the index.
The material has been provided by InstaForex Company – www.instaforex.com
Source:: Ichimoku indicator analysis of USDX for May 16, 2017


