
Previous Story
Ichimoku indicator analysis of USDX for September 19, 2017
Posted On 19 Sep 2017
Comment: 0
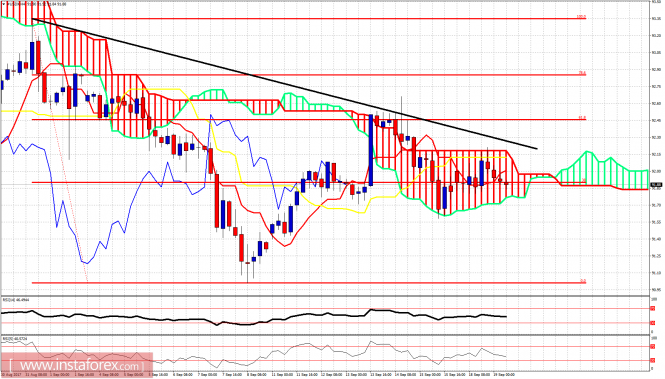
The Dollar index has bounced from early September and the 91 level towards 92.50 where it got rejected at the 61.8% Fibonacci retracement of the latest decline. Short-term trend is neutral. Price is mainly moving sideways, but daily and weekly trends remain clearly bearish.
Black line – resistance trend line
The Dollar index is trading inside the 4-hour Kumo (cloud). This implies that trend is neutral. Resistance is between 92.10 and 92.25, by the upper cloud boundary and the trend line. Support is at 91.70-91.75 by the lower Kumo boundary.
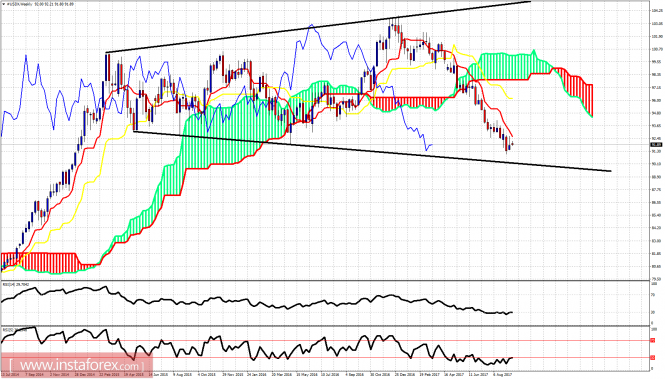
Black lines – megaphone pattern
The oscillators on the weekly chart are oversold and turning upwards. Price has barely managed to bounce however 1.5 point and still remains below the weekly tenkan-sen (red line indicator). Weekly resistance is at 92.60 and next at 96.10. The lower megaphone pattern line is at 90.20 this is where I expect price to eventually go.
The material has been provided by InstaForex Company – www.instaforex.com
Source:: Ichimoku indicator analysis of USDX for September 19, 2017


