
Previous Story
Intraday technical levels and trading recommendations for GBP/USD for November 5, 2018
Posted On 05 Nov 2018
Comment: 0
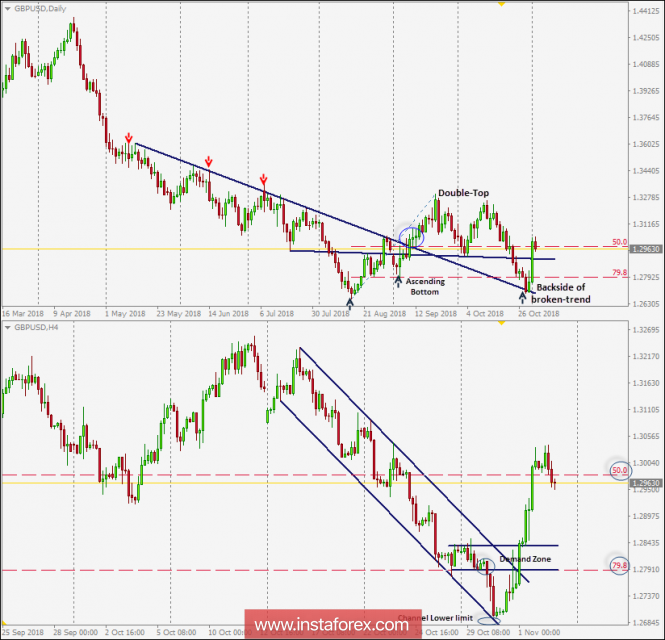
Since September 13, the GBP/USD pair has been demonstrating a successful bullish breakout above the depicted daily downtrend line which came to meet the pair around 1.3025-1.3090.
On September 21, GBP/USD failed to demonstrate sufficient bullish momentum above 1.3296. The short-term outlook turned to become bearish within the depicted H4 bearish channel to test the backside of the broken uptrend.
Bearish persistence below the price level of 1.2970 (50% Fibo level) enhanced a further decline towards 1.2790 where the lower limit of the movement channel and 79.8% Fibonacci Level were located.
On H4 chart, the GBP/USD pair looked oversold around the price levels of 1.2700. BUY entries were suggested around the lower limit of the depicted H4 channel (1.2690).
For the bullish daily breakout scenario to remain valid, bullish persistence above 1.2790 (the depicted channel upper limit) and an early breakout above 1.3000 (50% Fibo level) are needed to maintain sufficient bullish momentum.
That’s why, bullish persistence above the price zone of 1.2970-1.3000 (50% Fibonacci zone) is mandatory for a further rise towards 1.3130 and 1.3200.
On the other hand, bearish breakout below 1.2970 (50% Fibo level) allows further decline towards 1.2790 and 1.2660.
The material has been provided by InstaForex Company – www.instaforex.com
Source:: Intraday technical levels and trading recommendations for GBP/USD for November 5, 2018


