
Previous Story
Intraday technical levels GBP/USD for November 28, 2018
Posted On 28 Nov 2018
Comment: 0
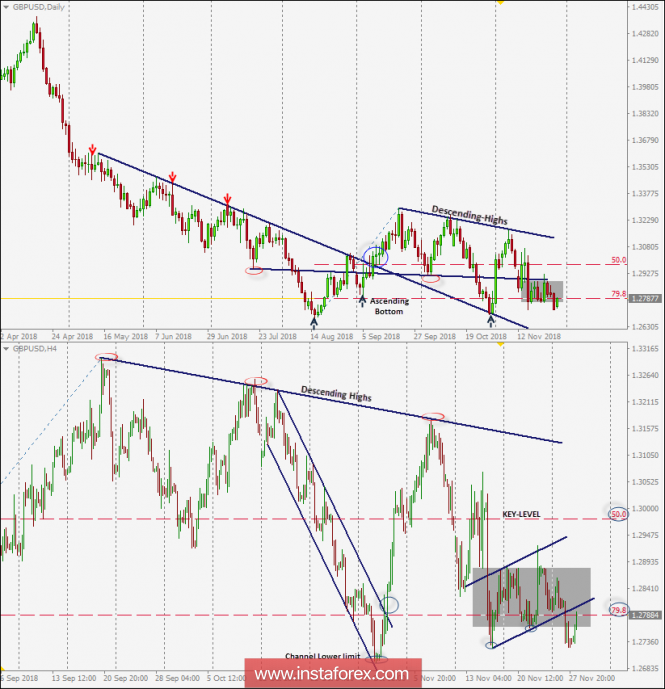
On September 21, the GBP/USD failed to demonstrate sufficient bullish momentum above 1.3296. Since then, the short-term outlook turned to become bearish under the depicted daily downtrend.
On H4 chart, the GBP/USD pair looked oversold around the price levels of 1.2700 where profitable BUY entries were suggested.
A Quick bullish movement was demonstrated towards the price level of 1.3170-1.3200 where another descending high around the depicted downtrend was established.
This initiated the current bearish pullback towards the depicted consolidation-zone of (1.2750-1.2880) where the current sideway movement within the depicted H4 channel was initiated.
Recently, the GBP/USD pair failed to establish a successful bullish breakout above the price level of 1.2880 (the upper limit of the current consolidation range).
Moreover, a quick bearish decline was demonstrated towards the price zone around 1.2750
The current scenario may pursue a bearish flag continuation pattern provided that bearish persistence below 1.2750 is maintained on a daily basis.
Projected target for the bearish flag continuation pattern is initially located around 1.2600.
The material has been provided by InstaForex Company – www.instaforex.com
Source:: Intraday technical levels and trading recommendations for GBP/USD for November 28, 2018


