
Previous Story
Monday 30th June: Weekly Technical Outlook and Review.
Posted On 30 Jun 2014
Comment: 0
For the readers’ benefit:
Price action confirmation: simply means traders will likely wait for price action to confirm a level by consuming the opposing supply or demand area, then entering a trade on a possible retracement, this may occur on the lower timeframes also.
Pending orders: means pending orders are likely seen.
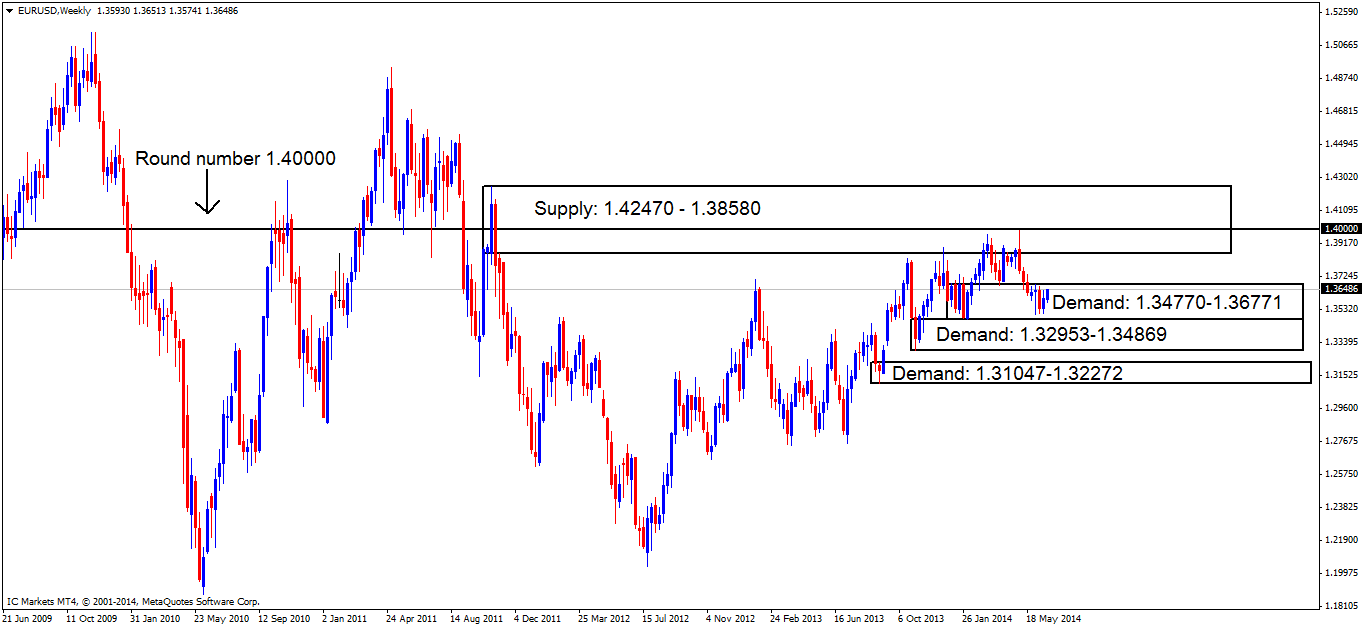
EUR/USD:
Weekly TF.
The weekly timeframe still shows price trading within demand at 1.34770-1.36771, a breakout above or below the base has yet to be seen though.
If a break below of the aforementioned demand area happens, price will immediately be trading within demand below at 1.32953-1.34869 which is the second layer of three stacked demand areas.
As of now price remains capped between demand at 1.34770-1.36771 and supply above at 1.42470-1.38580.
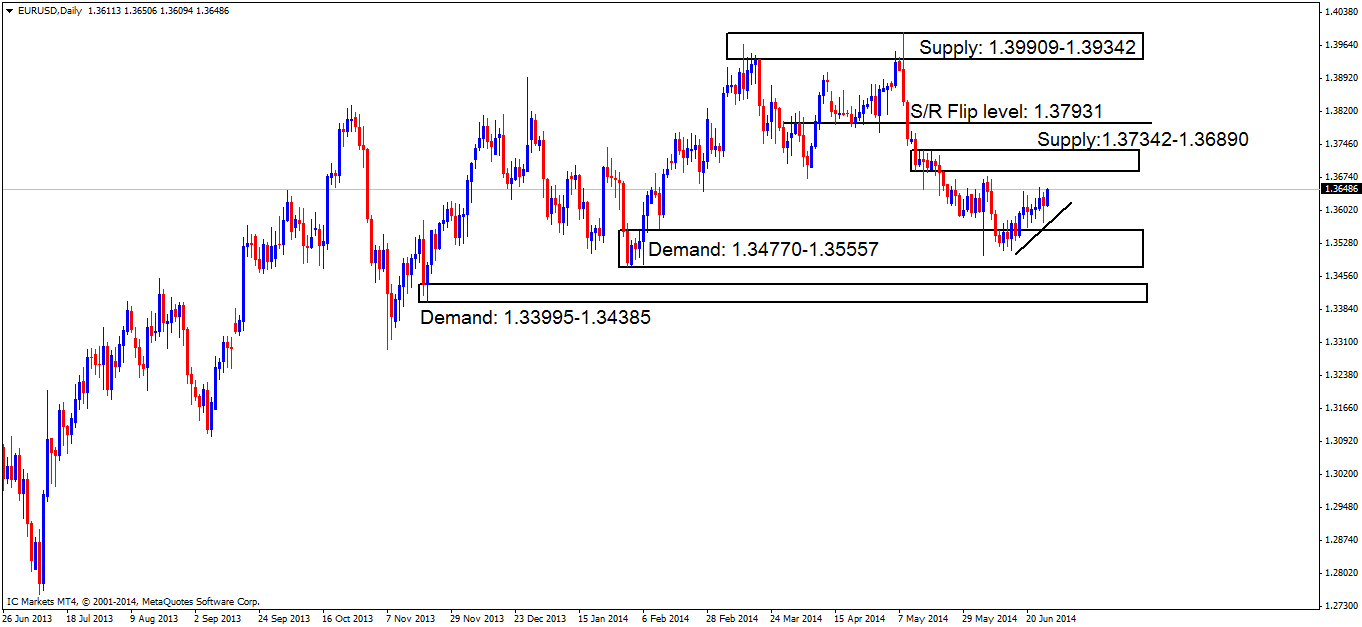
Daily TF.
The daily timeframe saw very little change last week, however it is worth remembering this from Friday’s analysis last week, as it still holds true:
Price still remains capped between supply above at 1.37342-1.36890 and demand below at 1.34770-1.35557 with a break of either area yet to be seen.
The small trendline placed on the chart is not there to represent a trend, it is more to show how pro money may be consuming small pockets of demand as price is rallying higher, thus clearing a path south for sellers to take over.
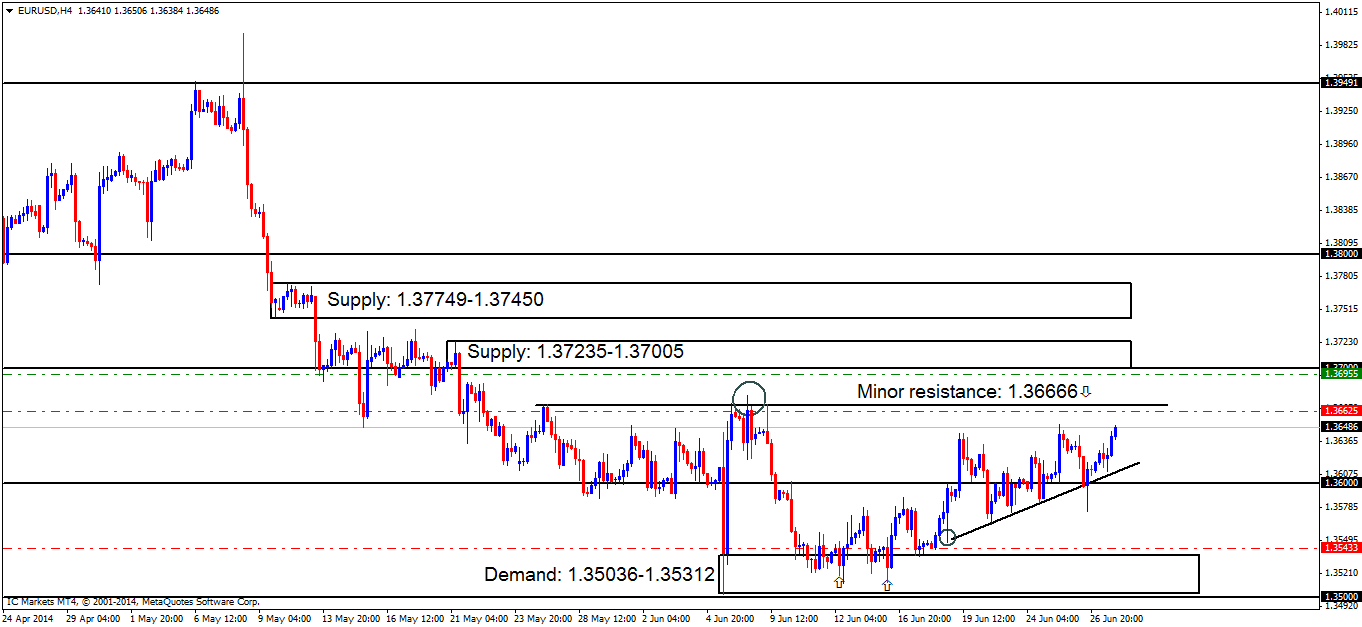
4hr TF.
Chart one below shows price had spiked the round number 1.36000 below, stopping out a large number of both buyers trying to go long there, and breakout sellers attempting to sell the breakout. Price then rallied a little, retested our triangle, then advanced, missing minor resistance at 1.36666 by about 17 pips.
Chart 1:

Chart two below shows the new alterations that have been made. A trendline has been placed on the chart to represent what pro money may be doing. Notice each time a higher high was made, price dropped to consume the buyers likely clearing a path for pro sellers, so do watch out for either minor resistance (1.36666) or supply above at 1.37235-1.37005 for a bearish reaction sometime today or tomorrow.
Pending/P.A confirmation orders:
- Pending buy orders (Green line) are seen around demand (1.33995-1.34298) at 1.34368 has been removed. Price is trading too far from the entry level.
- New P.A confirmation buy orders (Red line) are seen just above demand (1.35036-1.35312) at 1.35433. The reason behind us placing a P.A confirmation buy order here, rather than a pending buy order is because the aforementioned demand area appears weak as deep spikes have been seen recently (marked with two arrows), and also the circled tail/spike could have cleared out the majority of buy orders as it left.
- Pending sell orders (Green line) seen at 1.36955 just below supply at 1.37235-1.37005 are set here since this level remains untouched, meaning unfilled orders are likely still set around this area.
- P.A confirmation sell orders (Red line) are visible below the minor resistance 1.36666 at 1.36625, this level has proved valid in the past, but still needs to be confirmed due to a spike/wick (circled) seen above resistance, which may have consumed most of the sellers originally there.Do be on your guard with the sell orders above; the higher-timeframes are currently indicating higher prices may happen soon (Weekly demand: 1.34770-1.36771).
Chart 2:
Quick Recap:
The price action seen on the weekly timeframe still shows buyers and sellers battling it out within demand at 1.34770-1.36771, while on the daily timeframe pro money may be seen consuming minor demand pockets whilst rallying price, thus clearing a path for any pro sellers. The 4hr timeframe resembles what the daily timeframe is depicting, only with more detail. We currently have a P.A confirmation sell order set at 1.36625 just below minor resistance (1.36666) which will likely be hit today, and if the buyers have the strength, we may even see a push up to supply at 1.37235-1.37005 where we also have a pending sell order set just below at 1.36955.
- Areas to watch for buy orders: P.O: No pending buy orders are seen in the current market environment. P.A.C: 1.35433 (SL: Dependent on where price ‘confirms’ the level TP: Dependent on where price ‘confirms’ the level).
- Areas to watch for sell orders: P.O: 1.36955 (SL: 1.37270 TP: [1] 1.36666 [2] 1.36000) P.A.C:1.36625 (SL: 1.36810 TP: Dependent on where price ‘confirms’ the level).
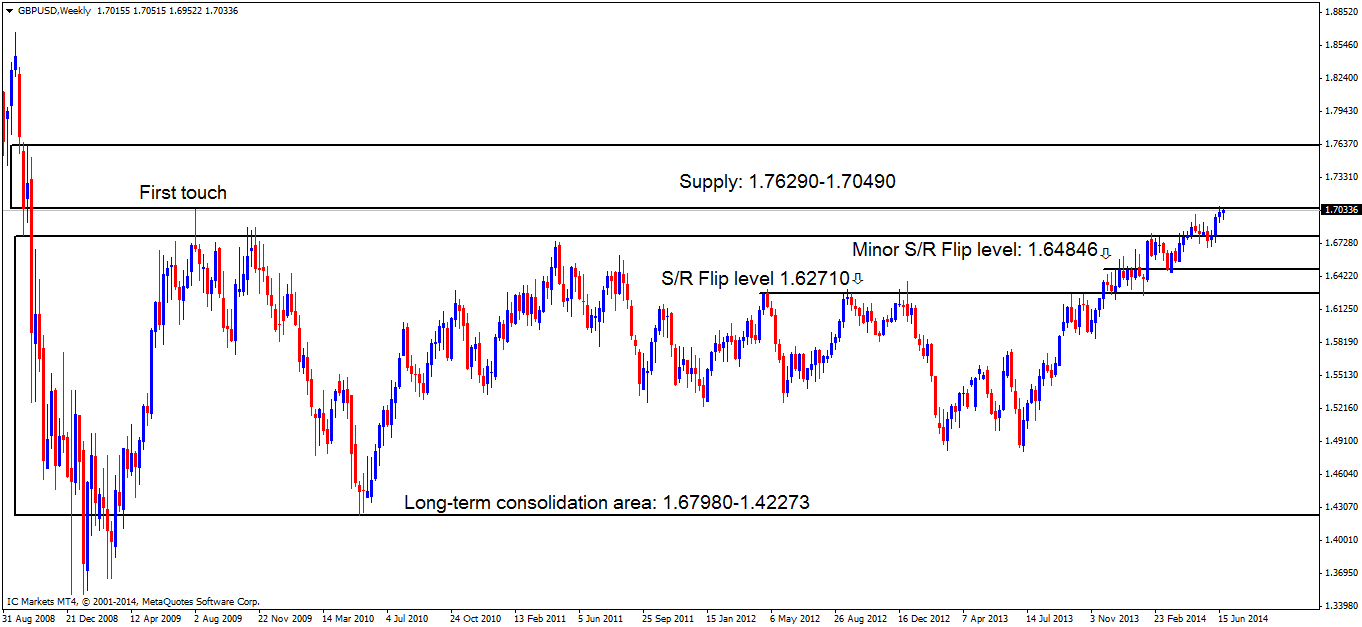
GBP/USD:
Weekly TF.
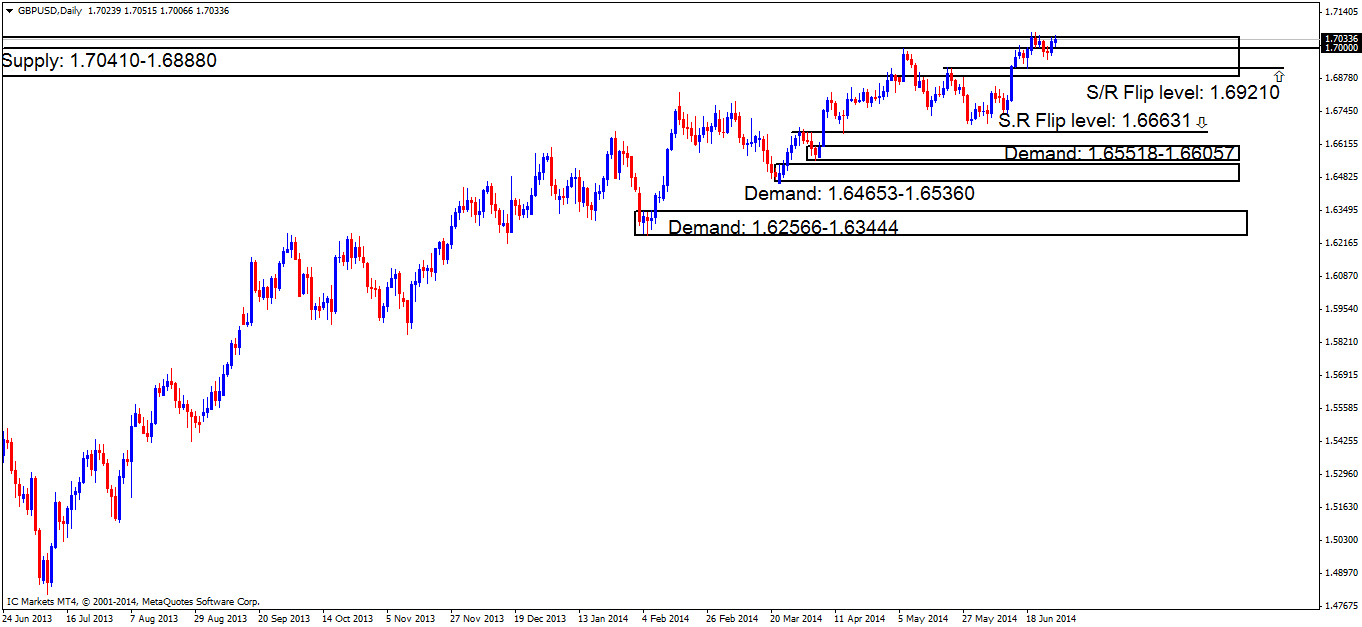
Price still remains trading at the base of weekly supply (1.76290-1.70490) with little action being seen from the sellers on this timeframe. The most recently closed weekly candle was unable to break the previous week’s high or low (1.70630/1.69198) forming what the majority of traders call an inside bar/candle. Taking all of the above into consideration, traders should be prepared for a possible push higher into the weekly supply area (levels above) sometime this week.
Additionally, price is currently seen capped between weekly supply (levels above) and the top of the long-term consolidation area at 1.67980.
Daily timeframe:
At the beginning of last week, this timeframe looked picture-perfect with three tails being seen above daily supply indicating a fakeout may have happened, as we were trading into weekly supply (levels above). The sellers seemed to have run out of steam here, active buyers were seen pushing price back up to the alleged fakeout point indicating this could this be a second test, or that price intends to break this area north. Hopefully this week we shall have our answer.
4hr TF.
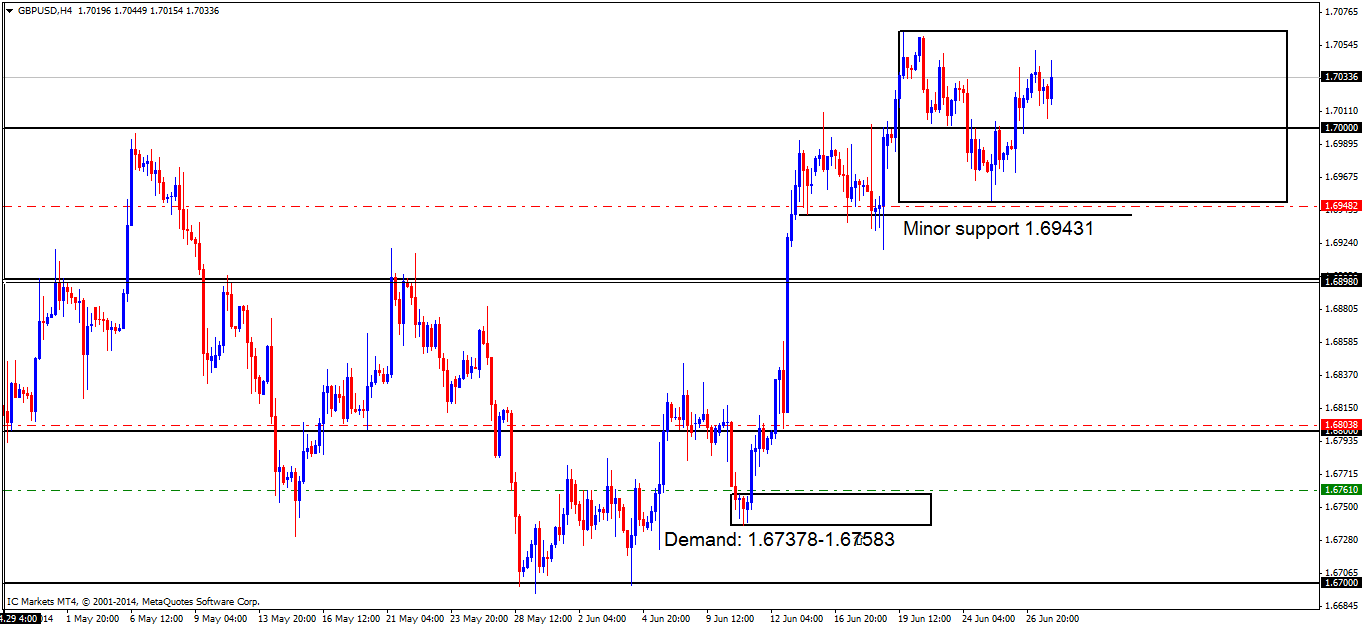
Chart one below shows the decision point area (supply) at 1.70320-1.70233 did see a small bearish reaction down to the round number 1.70000, but most traders were more than likely stopped out on the big red wick marked with an arrow.
Chart 1:
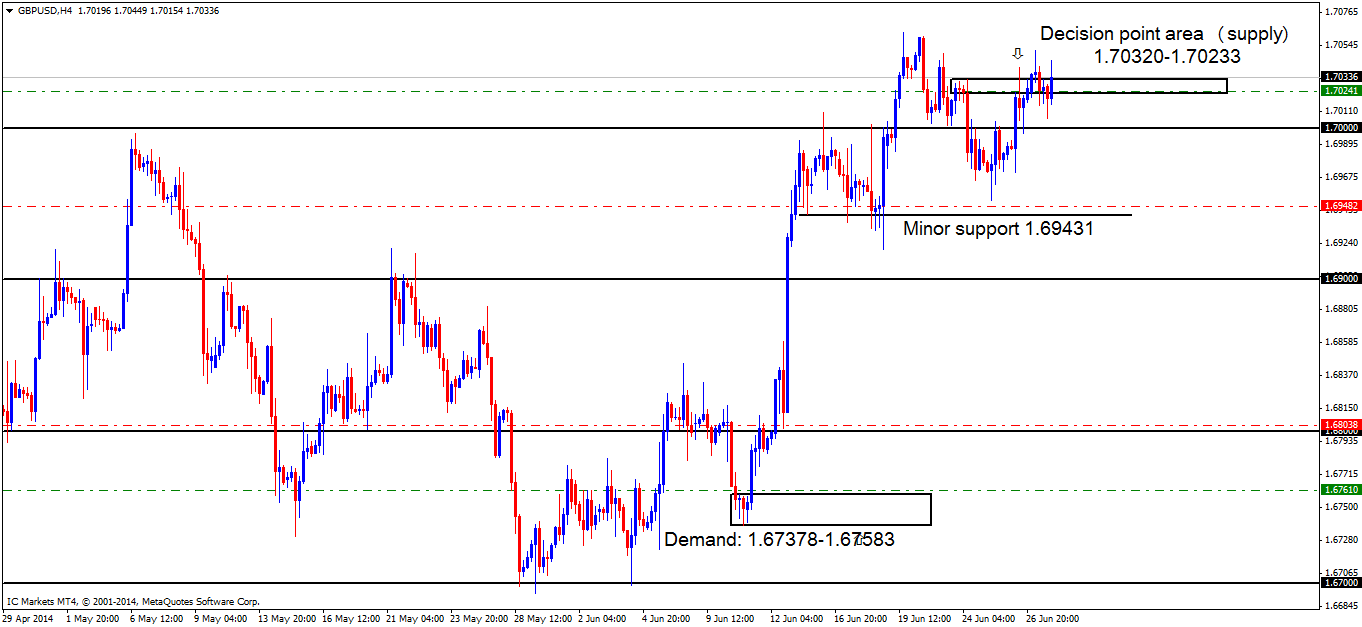
Chart two below shows the alterations that have been made. The price action is not presenting many selling opportunities, which is frustrating considering we’re currently trading around weekly supply (levels above). At the moment, price appears to be stuck between the high at 1.70630 and the low at 1.69522 (marked with a range box). A break above the high would see price trading deeper into weekly supply (levels above) which is the most likely scenario (as per the higher timeframe analysis above), conversely a break below the low would no doubt open more selling opportunities to us to short down to the round number 1.69000 at least.
Pending/P.A confirmation orders:
- Pending buy orders (Green line) are seen at 1.67610 just above demand at 1.67378-1.67583. A pending order is valid here due to the momentum away from the demand area, indicating orders may be left unfilled here.
- P.A confirmation buy orders (Red line) are seen just above the round number 1.68000 at 1.68038. A reaction may be likely here because of the way pro money used this level to rally prices higher with force, a quick change in direction like this likely indicates pro money activity, thus, all of their orders may have not been filled at that time. The reason a pending order is not used here is because pro money, on a regular basis perform deep stop hunts around big figure levels (1.68000), and these tails/wicks can be huge sometimes, hence the need to wait for confirmation.
- P.A confirmation buy orders (Red line) are seen just above minor support (1.69431) at 1.69482. A reaction north is likely to be seen here, however we are currently seeing higher-timeframe supply being hit on the weekly timeframe at 1.76290-1.70490, hence the need for a confirmation buy order, rather than a pending buy order.
- No pending sell orders (Green line) are seen in the current market environment.
- No P.A confirmation sell orders (Red line) are seen in the current market environment.
Chart 2:
Quick Recap:
The weekly timeframe sellers are currently showing weakness around weekly supply at 1.76290-1.70490, while the daily timeframe supports this weakness as active buyers were seen coming into the market mid last week. The 4hr timeframe is currently very difficult to trade, price needs to make a decision to either break above the high seen at 1.70630 or break below the low at 1.69522. We favor the former, as price on the higher timeframes are indicating selling weakness, thus a push higher may be seen sometime this week.
- Areas to watch for buy orders: P.O: 1.67610 (SL: 1.67345 TP: [1] 1.68000 [2] 1.69000 [likely to be changed, depending on price approach]). P.A.C: 1.68038 (SL: Dependent on approaching price action after the level has been confirmed TP: Dependent on approaching price action after the level has been confirmed). 1.69482 (likely to be set at 1.69176 TP: Dependent on approaching price action after the level has been confirmed).
- Areas to watch for sell orders: P.O: No pending sell orders seen in the current market environment. P.A.C: No P.A confirmation sell orders seen in the current market environment.
AUD/USD:
Weekly TF.
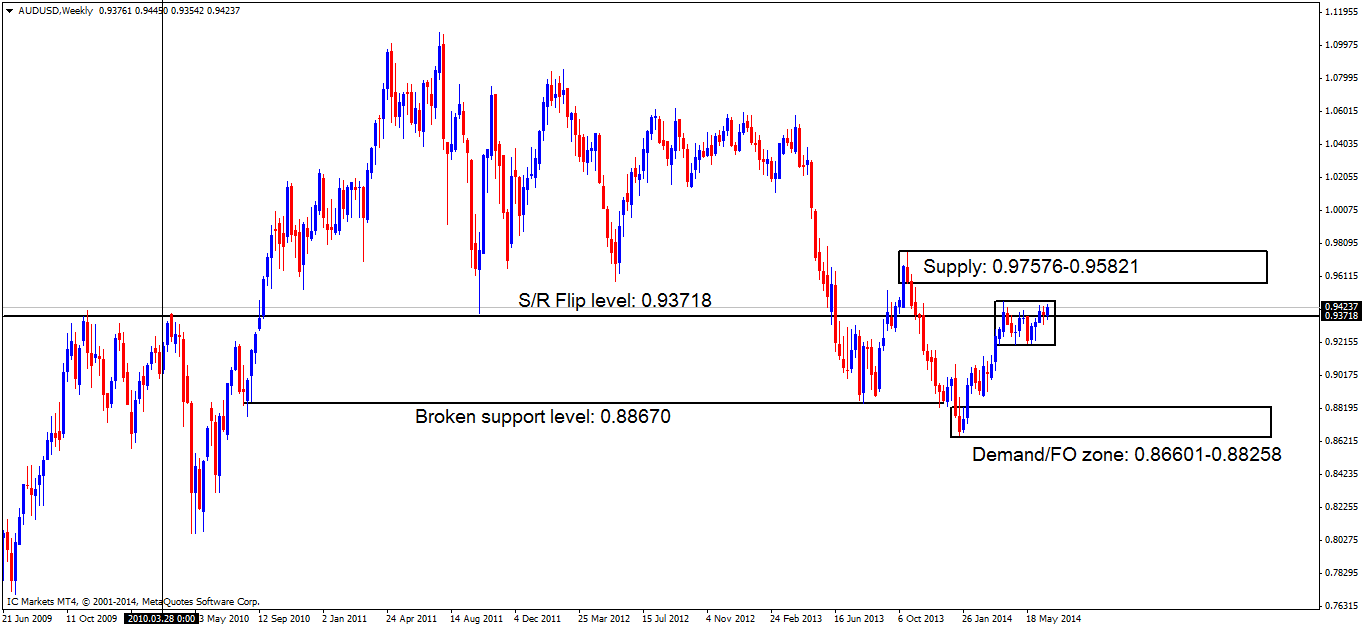
Price action is still seen consolidating around the S/R flip level at 0.93718, with no positive break in either direction being seen. If price breaks above this current consolidation, supply at 0.97576-0.95821 would very likely be hit, conversely, if price were to break lower, the demand/fo zone would likely be hit below at 0.86601-0.88258.
The recently closed weekly candle represented buying strength. A close above 13 previous weekly candles (within the consolidation) was seen, indicating we may very well see higher prices sometime this week.
Daily TF.
The daily timeframe supports the weekly timeframe in that daily supply seen at 0.94468-0.93758 is showing weakness. This weakness supports our prior theory regarding the circled wick to the left of the chart; we said that this wick may have consumed the majority of the sellers lurking in and around the aforementioned supply area.
Taking all the above into consideration, a push higher will very likely be seen sometime this week to at least fresh daily supply above at 0.95434-0.94862, so do keep a close eye on that!
As of now though, price still remains capped between supply at 0.94468-0.93758, and demand below at 0.92054-0.92633 with a break either side yet to be seen.

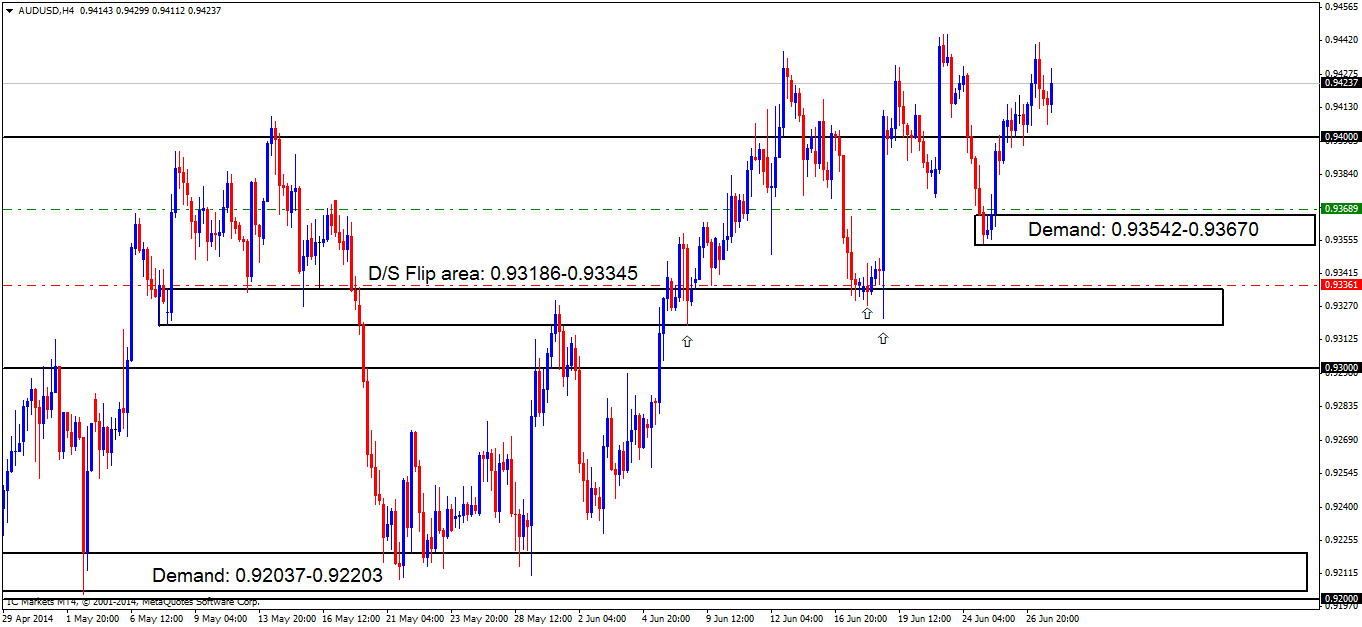
4hr TF.
Chart one below shows price saw a very small reaction off of our decision point (supply) area at 0.94270, but shortly after price pushed higher, stopping out most of the sellers attempting to short this area.
Chart 1:

Chart two below shows the new alterations that have been made. The demand area seen at 0.93542-0.93670 may well be the area pro money use to push prices higher this week. This would no doubt confuse a lot of traders expecting price to just shoot to the moon straight away without pro money collecting the much-needed liquidity for a move higher. However, the round number 0.94000 just below may be an area to watch out for, as it is very likely pro money will perform a deep stop hunt here first, testing how many buyers are active around this level, so do be on the lookout for this also.
If price does indeed breakout higher, keep an eye on the 4hr supply area above at 0.95434-0.95057 (not seen on the chart), which is located deep within daily supply at 0.95434-0.94862.
Pending/P.A confirmation orders:
- New pending buy orders (Green line) are seen just above demand (0.93542-0.93670) at 0.93689. A pending order was permitted to be set here due this demand area showing buying strength clearly created by pro money, meaning unfilled buy orders may still be lurking there.
- New P.A confirmation buy orders (Red line) are seen just above demand (0.93186-0.93345) at 0.93361. The reason a P.A confirmation buy order was placed here rather than a pending buy order, was simply because previous price action shows the buyers in and around the demand area (levels above) may have been consumed with those deep spikes/tails marked with arrows.
- P.A confirmation buy orders (Red line) are seen at 0.92231 just above demand at 0.92037-0.92203 have been removed. Price has rallied too far from the entry point.
- P.A confirmation buy orders (Red line) are visible just above the round number 0.93000 at 0.93025 have been removed. Price has rallied too far from the entry point.
- The pending sell order (Green line) set at 0.94447 around the high 0.94613 has now been closed with a nice profit.
- The pending sell order (Green line) set just below the decision point supply area (0.94270) at 0.94251 has been stopped out.
- No P.A confirmation sell orders (Red line) are seen in the current market environment.
Chart 2:
Quick Recap:
Buying strength is being currently seen on the weekly timeframe, while the daily timeframe currently supports this assumption since the buyers are appearing to be too strong for the sellers within the daily supply area at 0.94468-0.93758. The 4hr timeframe indicates a small retracement may need to happen to at least the round number below at 0.94000 before any advance higher is seen today or later this week.
- Areas to watch for buy orders: P.O: 0.93689 (SL: 0.93510 TP: Dependent on approaching price action). P.A.C: 0.93361 (SL: Dependent on approaching price action after the level has been confirmed TP: Dependent on approaching price action after the level has been confirmed).
- Areas to watch for sell orders: P.O: No pending sell orders seen in the current market environment. P.A.C: No P.A confirmation sell orders seen in the current market environment.
USD/JPY:
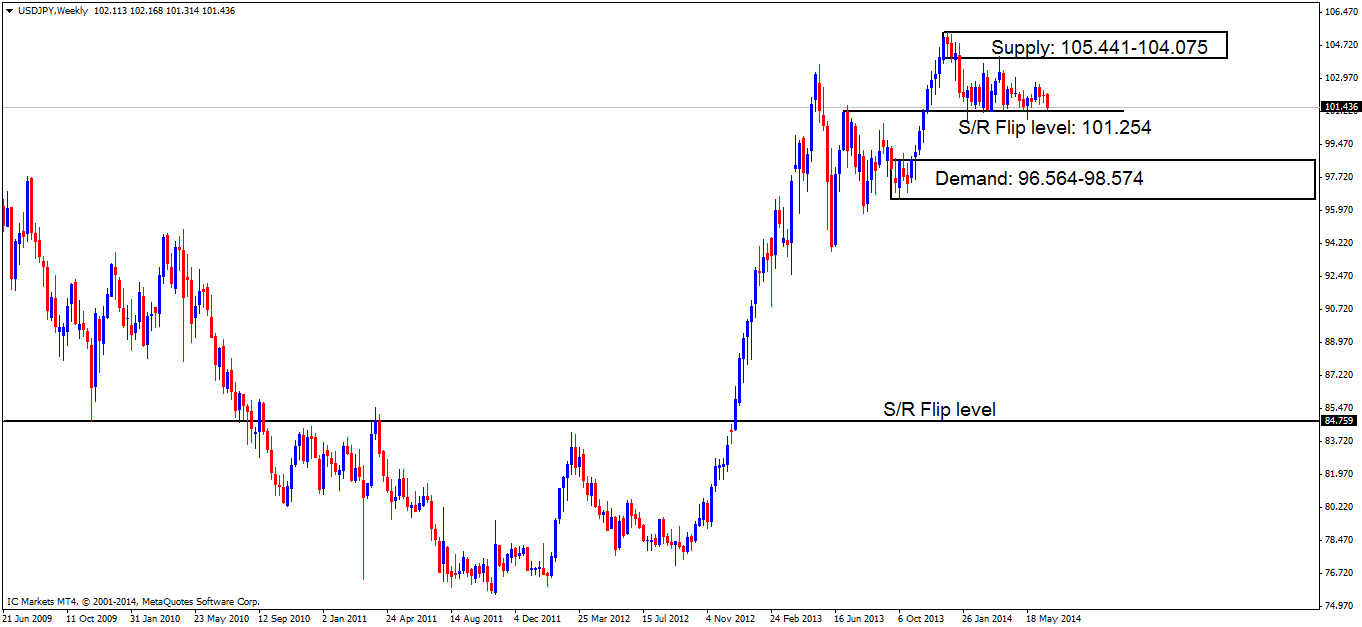
Weekly TF.
The sellers really took control last week driving price back down to the weekly S/R flip level at 101.254 with buyers showing little to no interest all week.
If price breaks this lower S/R flip level (levels above), we may likely see price push down towards weekly demand at 96.564-98.574, conversely, If we see a bullish reaction at the S/R flip level just mentioned, we can possibly expect higher prices in the coming weeks.
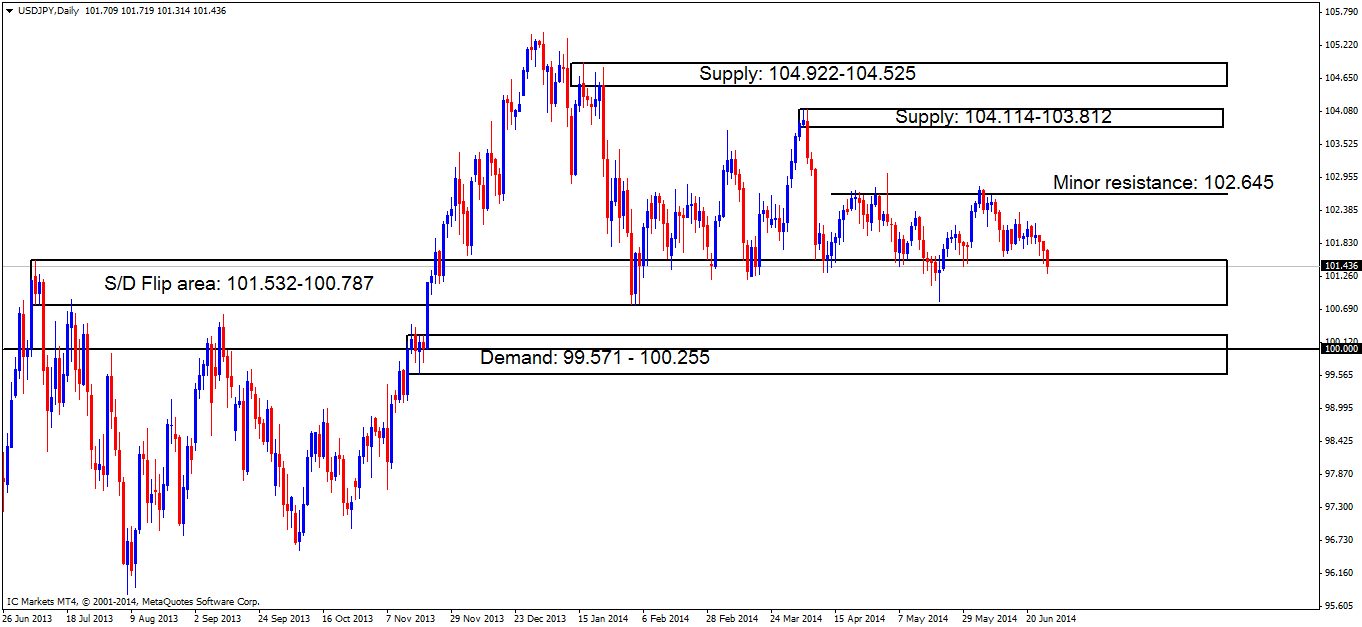
Daily TF.
Not much has changed since the last weekly analysis on Monday. Price still remains capped between daily demand at 101.532-100.787 and daily supply (minor resistance) above at 102.645. A break below the aforementioned daily demand area will likely force price to test daily demand below at 99.571-100.255 coupled with the round number 100.000 within, conversely a break above daily supply (levels above) could very likely see price testing oncoming supply at 104.114-103.812.
4hr TF.
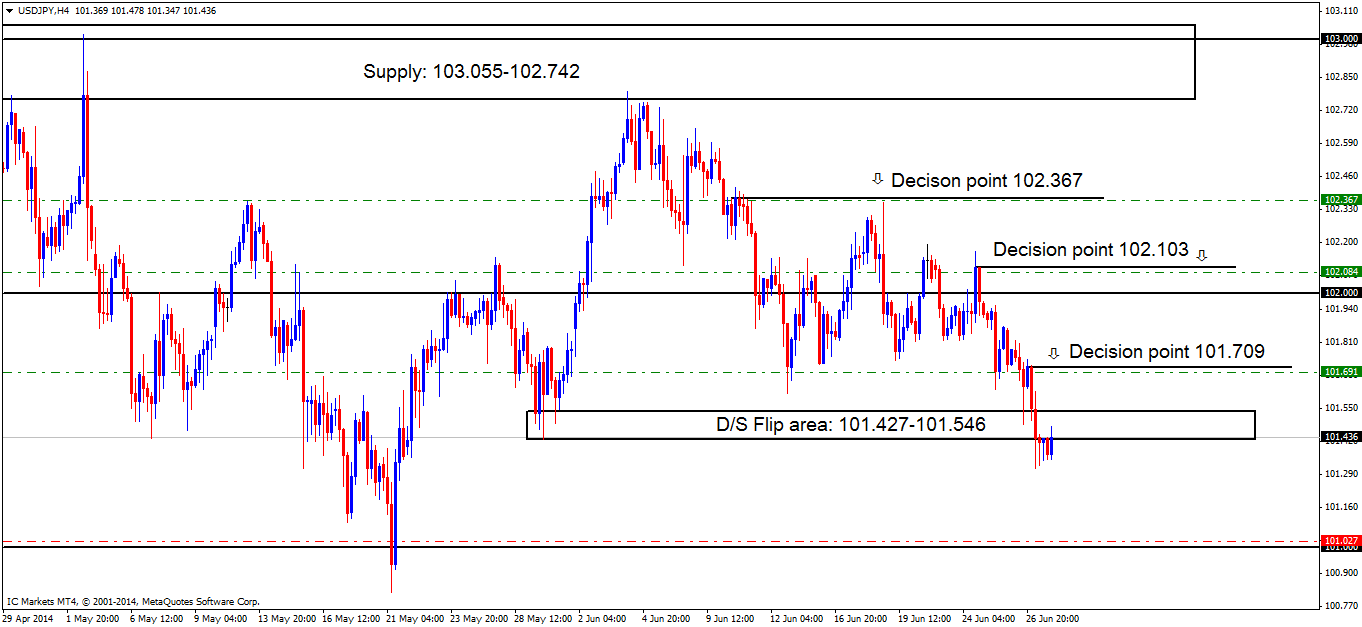
Chart one below shows that 4hr demand at 101.427-101.660 did not hold as reported it may do in Friday’s analysis. A break of this demand area just mentioned will now likely push price lower to around the round number 101.000 area sometime this week.
Chart 1:
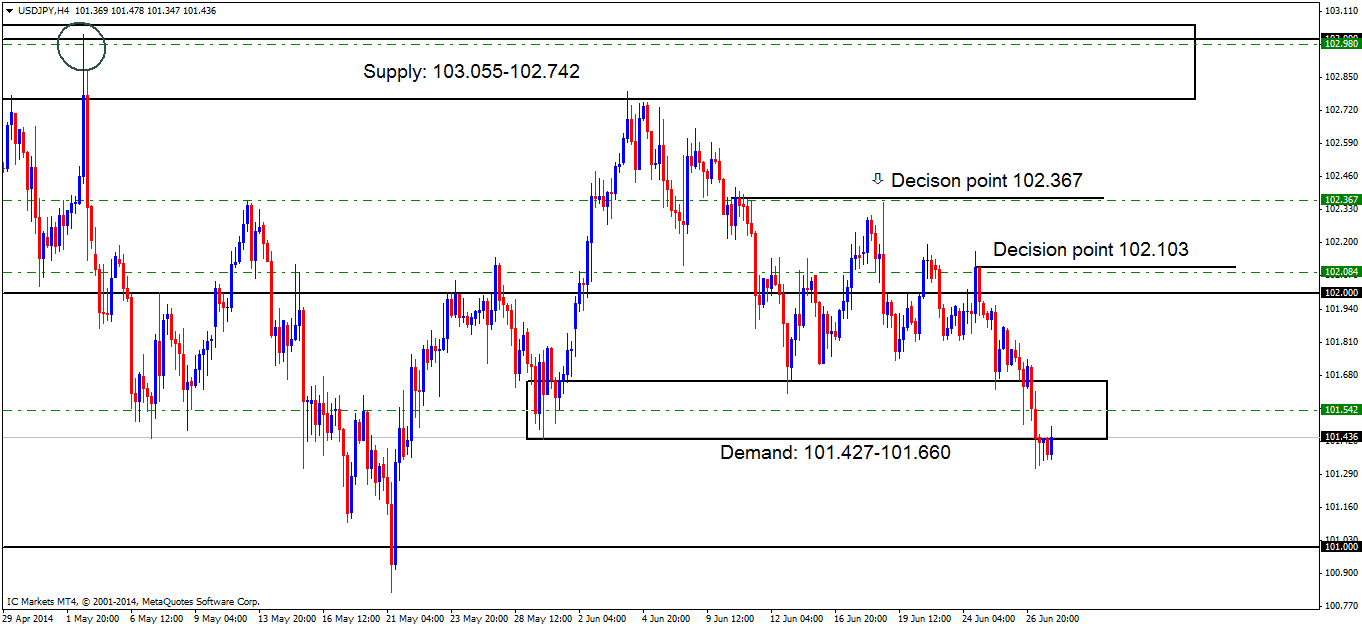
Chart two below shows the alterations that needed to be made. From price breaking demand 101.427-101.660, a new D/S flip area has formed at 101.427-101.546. Price now remains capped between supply (D/S flip area) at 101.427-101.546 and demand below (round number) at 101.000. With price currently hitting higher-timeframe demand (Weekly: 101.254 Daily: 101.532-100.787), higher prices are more than likely going to be seen sometime this week. However, considering we have just seen a break of demand (101.427-101.660 [chart one]) we may see lower prices to the round number below at 101.000 before any rally in price happens.
Pending/P.A confirmation orders:
- The pending buy order (Green line) set deep within demand (101.427-101.660) at 101.542 has been stopped out for a breakeven trade (see chart one).
- New P.A confirmation buy orders (red line) are seen just above the round number (101.000) at 101.027. The reason a P.A confirmation buy order was used here is because pro money on a regular basis perform deep spikes through these levels stopping countless traders out, hence the need to wait for confirmation.
- The pending sell order (Green line) visible at 102.980, deep within supply (103.055-102.742) has been removed due to price moving too far from the entry level (see chart one).
- Pending sell orders (Green line) are seen at 102.367. A pending order is valid here since this is the area where pro money made the ‘decision’ to break the low 102.113 and take prices lower into what was demand (101.427-101.660) at the time (seen on chart one) meaning unfilled sell orders were likely left there in the process.
- Pending sell orders (Green line) are seen at a decision point (102.103) at 102.084. Pending sell orders are viable here due to this being an important decision point level where pro money decided to break multiple lows and visit what was demand (101.427-101.660) at the time (seen on chart one), thus giving the impression unfilled sell orders may be left there as price did change direction very quickly.
- New pending sell orders (Green line) are seen just below the decision point (101.709) at 101.691. A pending order was permitted to be placed here since pro money clearly made a decision to consume the majority of the buyers around what was demand at 101.427-101.660 at the time (seen above on chart one), meaning there were more than likely unfilled sell orders left behind in the process.
- No P.A confirmation sell orders (Red line) are seen in the current market environment.
Chart 2:
Quick Recap:
The weekly timeframe is currently seen trading around weekly support at 101.254, while the daily timeframe is presently showing price trading within daily demand at 101.532-100.787. The 4hr timeframe shows price had consumed demand at 101.427.101.660 on Friday, clearing the path for sellers down to at least the round number below at 101.000. Considering price is in higher-timeframe demand, we will likely see higher prices sometime this week, however do be prepared for the sellers to push price south towards the round number area (101.000) before an advance is seen.
- Areas to watch for buy orders: P.O: No pending buy orders are seen in the current market environment. P.A.C: 101.027 (SL: Dependent on approaching price action after the level has been confirmed TP: Dependent on approaching price action after the level has been confirmed).
- Areas to watch for sell orders: P.O: 102.367 (SL: 102.458 TP: Dependent on how price action approaches this area) 102.084 (SL: 102.184 TP: Dependent on how price approaches this area) 101.691 (SL: 101.759 TP: Dependent on how price approaches this area P.A.C: No P.A confirmation sell orders are seen in the current market environment.
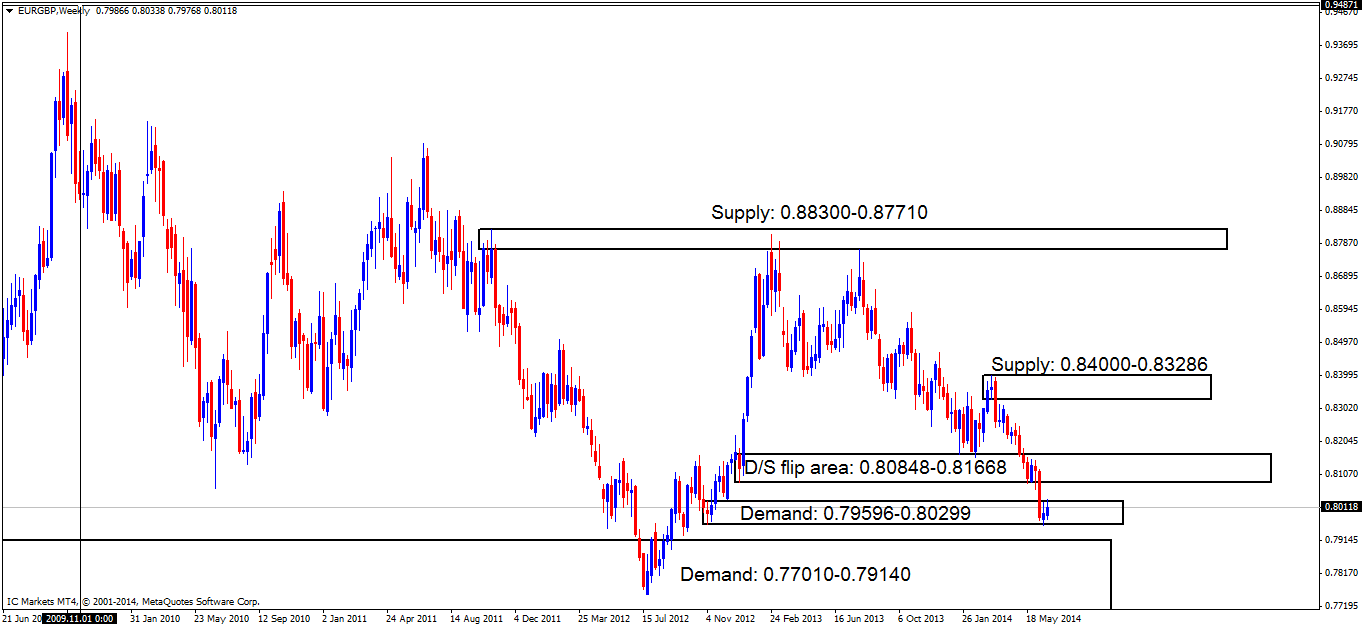
EUR/GBP:
Weekly TF.
Active buyers were seen within weekly demand at 0.79596-0.80299 last week. Price managed to trade above the previous weekly high (0.80251) forming a higher high at 0.80338. As per this timeframe, higher prices are expected to be seen this week, but do not discount the possibility of a retracement beforehand (lower timeframes will no doubt provide more information regarding the possible retracement).
Price still remains capped between the weekly demand area just mentioned and weekly supply at 0.80848-0.81668.
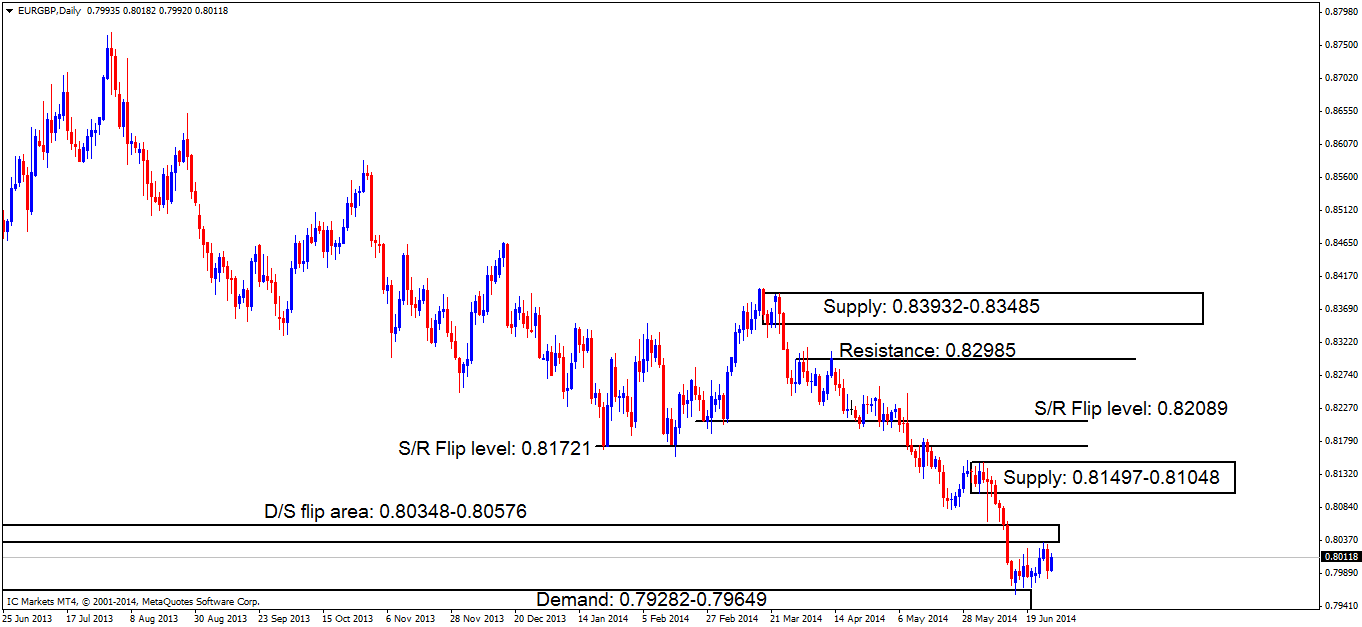
Daily TF.
Price still remains capped between daily demand at 0.79282-0.79649 and daily supply (D/S flip area) at 0.80348-0.80576. According to the weekly timeframe above, we may see the daily supply area just mentioned get consumed, with price using the daily demand area mentioned above to push prices higher, hence the chance of a retracement happening before a rally occurs.
If price does indeed break above the daily supply area (levels above) we will likely see daily supply at 0.81497-0.81048 get tested soon after.
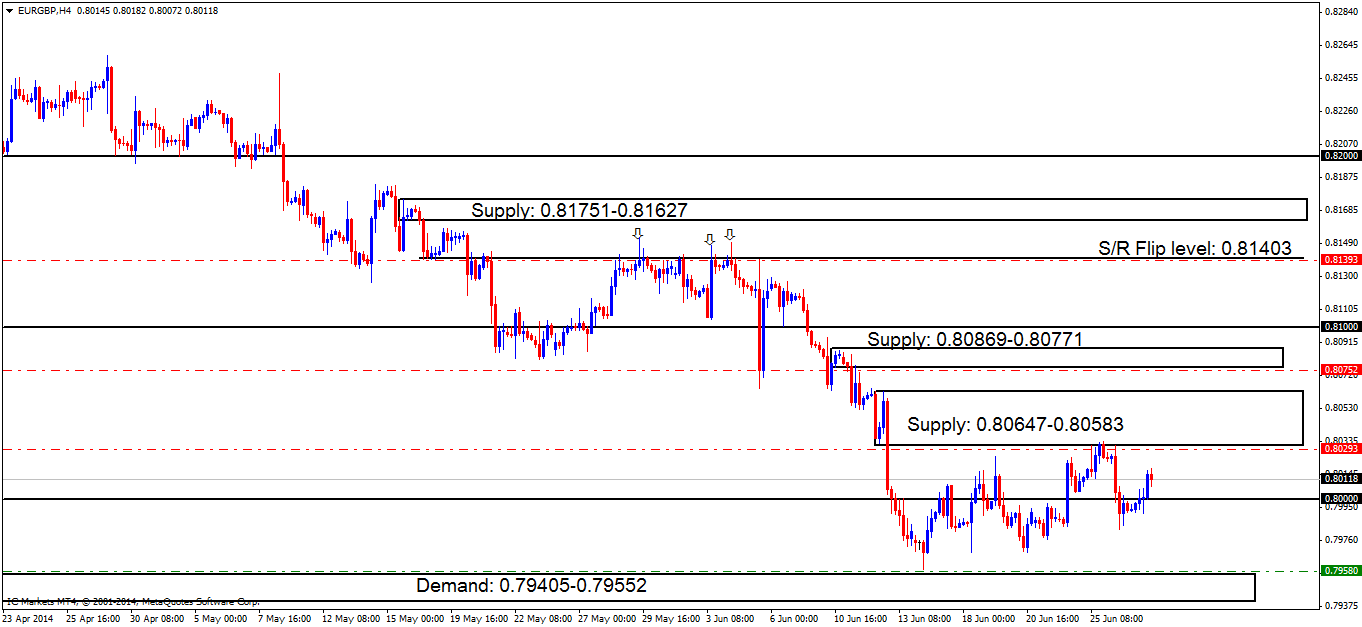
4hr TF.
Price still remains capped between supply at 0.80647-0.80583 and demand below at 0.79405-0.79552 with a break either side yet to be seen. The weekly timeframe shows price is trading around higher-timeframe demand (levels above); this does not however mean price will rally immediately today, breaking supply at 0.80647-0.80583. Pro money will likely bring prices south sometime this week to around 4hr demand at 0.79405-0.79552 thus allowing them to collect the much-needed liquidity (sell orders to buy into) for a rally higher in price.
Pending/P.A confirmation orders:
- A pending buy order (Green line) has been set at 0.79580 just above demand at 0.79405-0.79552. The rationale behind this is because buyers have likely consumed the majority of the sellers lurking around the round number 0.80000 and supply above at 0.80647-0.80583 likely clearing the path for higher prices. A small retracement to demand (levels above) will possibly be seen to collect more buyers for a rally higher, thus triggering our pending buy order.
- No P.A confirmation buy orders (Red line) are seen in the current market environment.
- No pending sell orders (Green line) are seen in the current market environment.
- P.A confirmation sell orders (Red line) under the S/R flip level 0.81403 at 0.81393 is an area where a reaction is likely, however there were too many wicks north seen marked with arrows, indicating sellers are drying up, thus, the need to wait for more confirmation.
- P.A confirmation sell orders (Red line) are seen just under supply (0.80869-0.80771) at 0.80752. Confirmation orders were used here because price is trading around a weekly demand area (0.79596-0.80299), which means price could easily consume this supply level as the higher timeframes usually overrule the lower timeframes.
- The P.A confirmation sell order (Red line) set just below supply (0.80647-0.80583) at 0.80293 is now active. Considering the higher-timeframe location seen on the weekly chart (Weekly demand: 0.79596-0.80299) , the sellers will need to consume the majority of the buyers around the 4hr demand area below at 0.79405-0.79552 to confirm this zone; a pending sell order can then be set awaiting a possible retracement.
Quick Recap:
The weekly timeframe currently shows active buyers within weekly demand at 0.79596-0.80299, while on the daily timeframe price remains capped between supply 0.80348-0.80576 and demand at 0.79282-0.79649. The 4hr timeframe is displaying a small uptrend that is just beginning, however do not be fooled by this, as price could very well turn south anytime this week to around 4hr demand at 0.79405-0.79552 before the real up trend begins.
- Areas to watch for buy orders: P.O: 0.79580 (SL: 0.79368 TP: [1] 0.80000 [2] 0.80583 [May change if any new developments in the market are seen]) P.A.C: No P.A confirmation buy orders are seen in the current market environment.
- Areas to watch for sell orders: P.O: No pending sell orders are seen in the current market environment. P.A.C: 0.81393 (SL: Will be likely set at 0.81564 TP: Will be likely set at the round number 0.81000) 0.80752 (SL: likely to be set at 0.80900 TP: Dependent on where price ‘confirms’ the level) 0.80293 (Active-awaiting confirmation) (SL: likely to be set at 0.80648 TP: Dependent on where price ‘confirms’ the level).
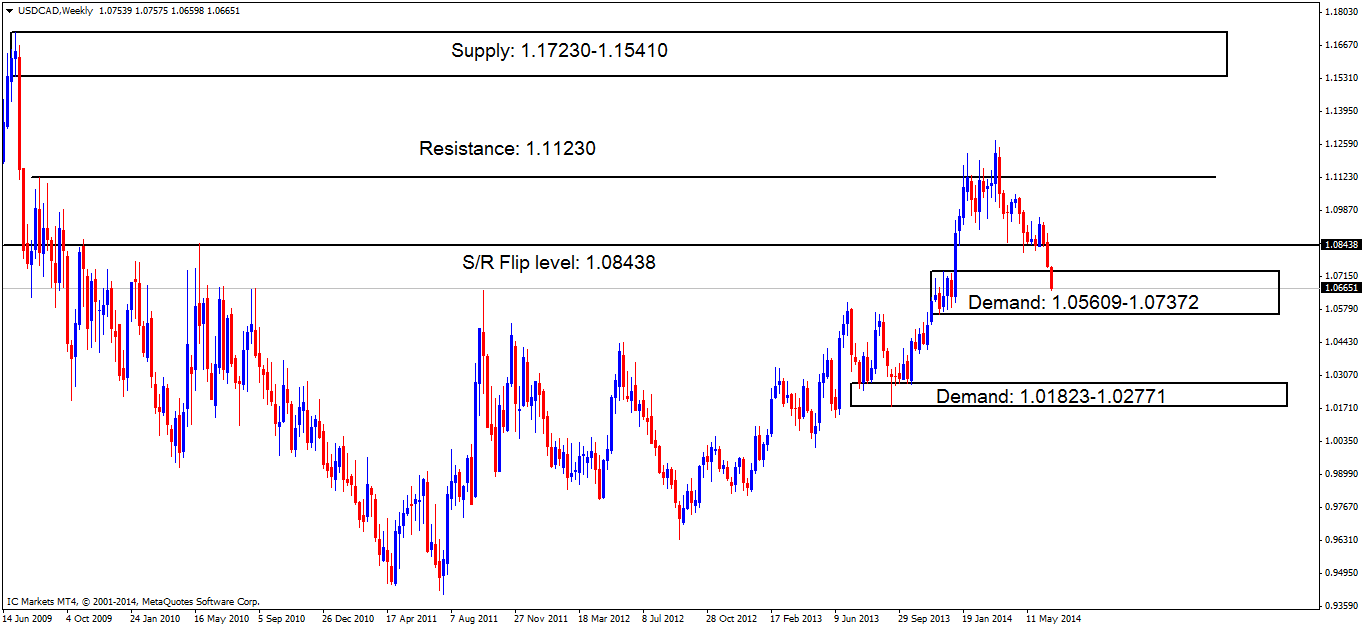
USD/CAD:
Weekly TF.
Weekly demand at 1.05609-1.07372 is currently being tested. The buyers are showing very little interest at the moment with sellers aggressively consuming buy orders within the aforementioned weekly demand area.
Price remains capped between the weekly demand area just mentioned and weekly supply (S/R flip level) at 1.08438. If a break below the weekly demand area (levels above) happens, price will likely be forced to test the overall origin of the move up around demand at 1.01823-1.02771.
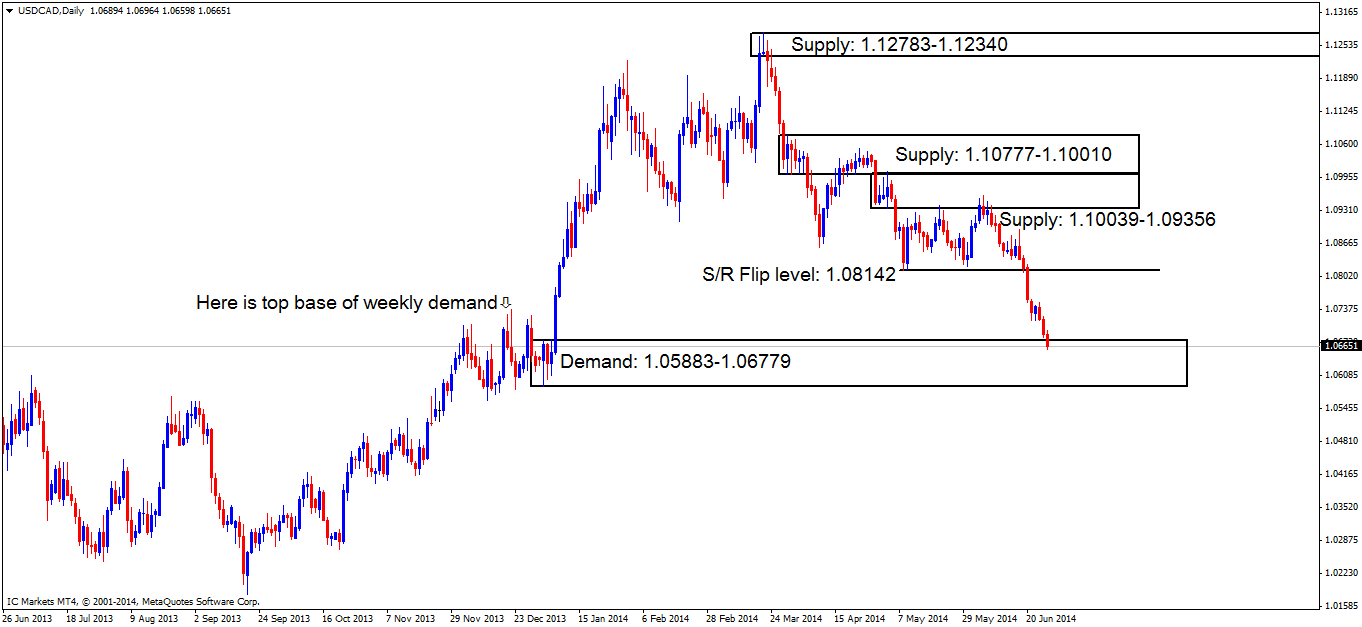
Daily TF.
Beautiful! Some may remember it was reported in Friday’s analysis, price may drop further into daily demand at 1.05883-1.06779, and this did happen Friday last week. A bullish reaction is very likely to be seen here, however price may trade a little deeper into this daily demand area before we see active buyers come into the market.
Price now remains capped between the daily demand area just mentioned and supply (S/R flip level) at 1.08142.
4hr TF.
The 4hr timeframe shows a sharp drop was seen last week consuming any buyers around the round number 1.07000. It was expected in Friday’s analysis this drop may happen, but not before a rally to our decision point at 1.07481 which of course, did not happen.
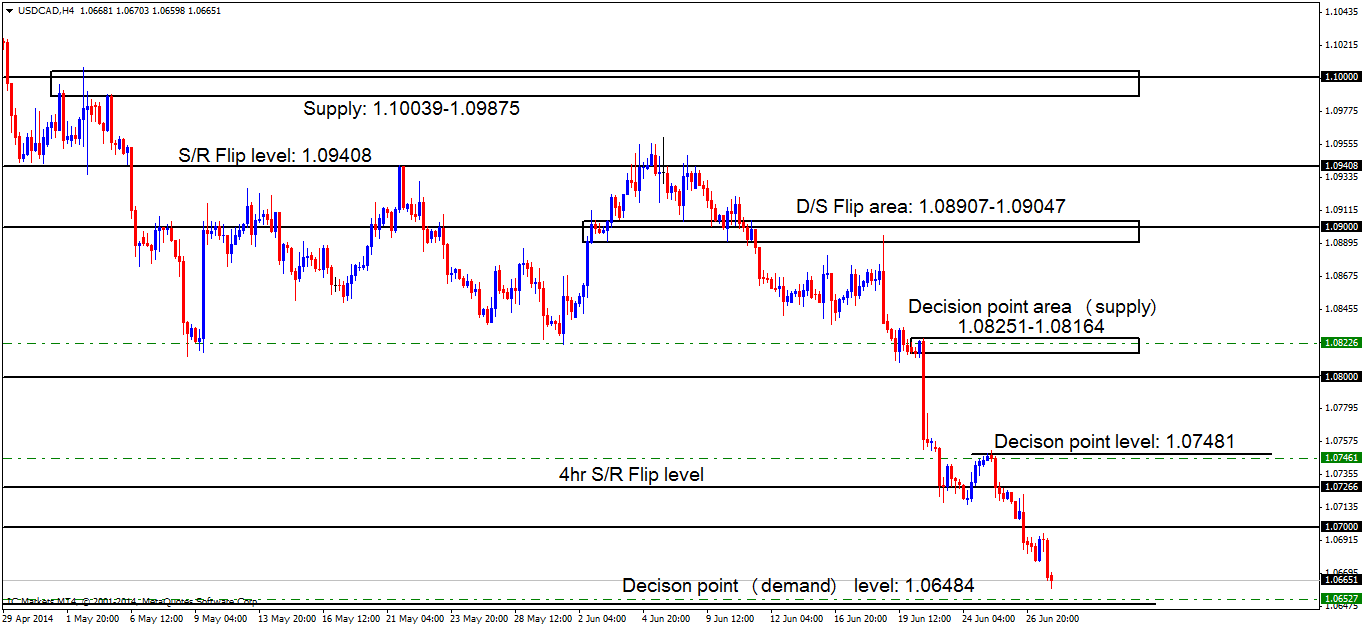
As we are all aware price is now trading within both Weekly and Daily demand areas (levels above), and higher prices are expected. However, price could very well drop to a nice-looking decision point level at 1.06484 before a rally higher is seen (chart two). Chart one shows how important the decision point level is to the left (marked with an arrow), notice how this was the last decision made by pro money here to push prices higher making it a great area to look for buying opportunities.
Pending/P.A confirmation orders:
- New pending buy orders (Green line) are seen just above the decision point level (1.06484) at 1.06527. A pending order is valid here due to price being contained within higher-timeframe demand (Weekly: 1.05609-1.07372 Daily: 1.05883-1.06779) coupled with the fact that this was the last decision made by pro money (in the past) to rally price to new highs.
- No P.A confirmation buy orders (Red line) are seen in the current market environment.
- The pending sell order (Green line) set at 1.08975; within supply (1.08907-1.09047) just below the round number 1.09000 has been removed due to price dropping too far from the entry level.
- Pending sell orders (Green line) are seen within the decision point supply area (1.08251-1.08164) at 1.08226. Pending orders are valid here due this likely being the work of pro money, the momentum out of the zone is only caused by traders with big accounts, and when pro money move the market, all of their orders here were unlikely to have been filled, hence a pending order being a logical choice here.
- Pending sell orders (Green line) are seen around the decision point level (1.07481) at 1.07461. A pending sell order is valid here due to this being the last ‘obvious’ decision made by pro money that consumed buyers around the S/R flip level at 1.07266, unfilled sell orders may have been left here in the process. However, we still have to remain aware, as we’re currently seeing price trading in higher-timeframe demand (Weekly: 1.05609-1.07372 Daily: 1.05883-1.06779), so we would need to exit this position at the first sign of trouble if the sell order does indeed get filled.
- No P.A confirmation sell orders (Red line) are seen in the current market environment.
Chart 1:
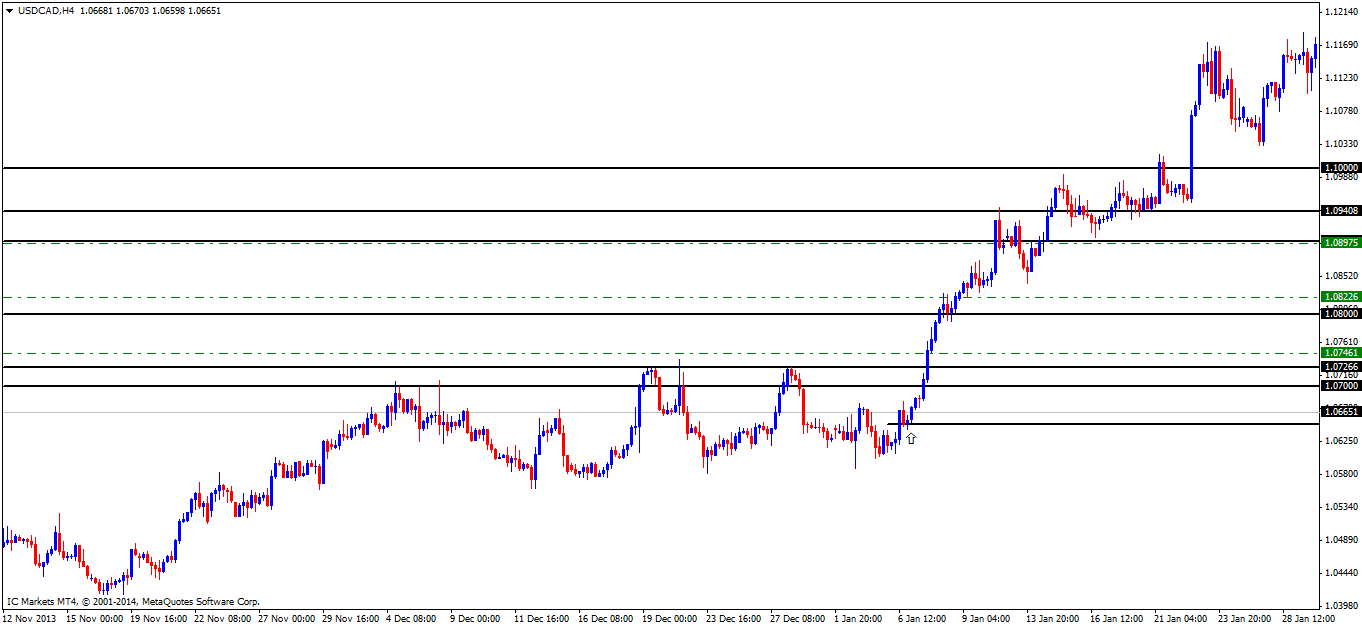
Chart 2:
Quick Recap:
The weekly timeframe shows the sellers have aggressively sold into weekly demand at 1.05609-1.07372, while on the daily timeframe; price has reached daily demand at 1.05883-1.06779. On the 4hr timeframe, a small decline in value is expected to be seen to around the decision point level at 1.06484, where we currently have a pending buy order set at 1.06527, before higher prices are seen.
- Areas to watch for buy orders: P.O: 1.06257 (SL: 1.06319 TP: Dependent on approaching price action). P.A.C: There are no P.A confirmation buy orders seen within the current market environment
- Areas to watch for sell orders: P.O:1.08226 (SL: 1.08357 TP: Dependent on approaching price action) 1.07461 (SL: 1.07550 TP: Dependent on how price approaches this level). P.A.C: There are no P.A confirmation sell orders seen within the current market environment.
USD/CHF:
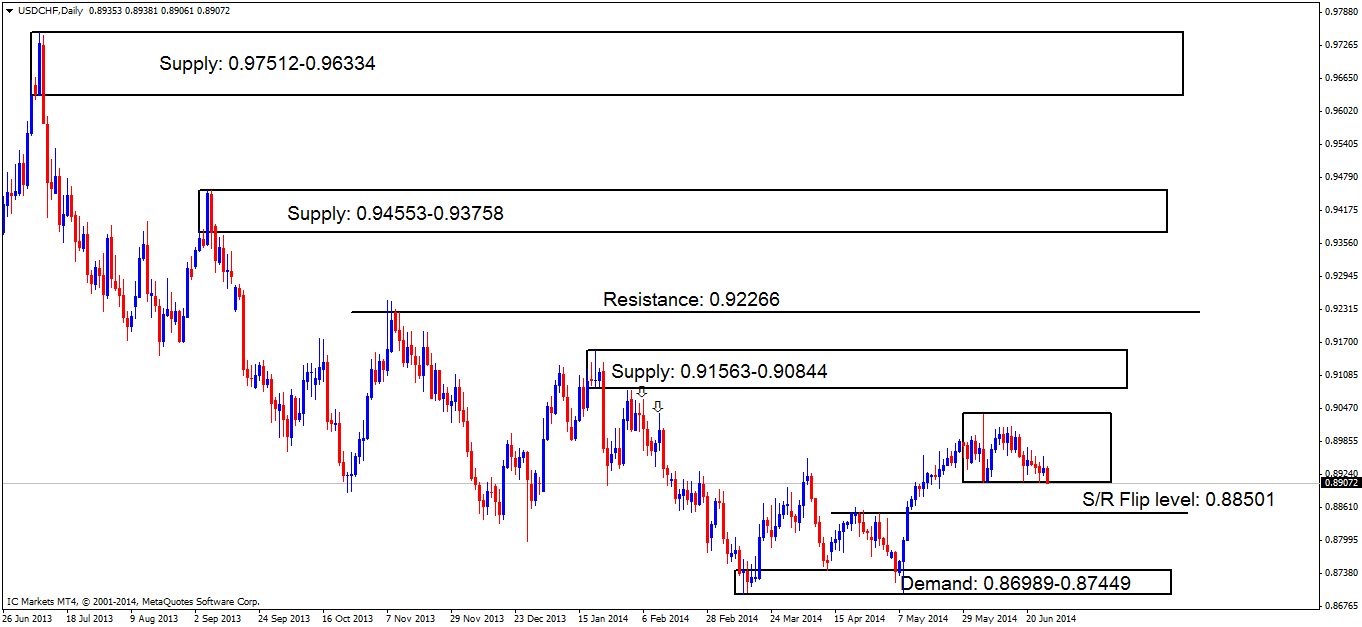
Weekly TF.
The weekly timeframe shows price has reacted off of the higher of the two stacked weekly demand areas at 0.85670-0.88360. However the bullish momentum did not last very long with price being seen consolidating just above the aforementioned weekly demand area.
Price remains capped between the weekly demand area just mentioned and the lower of the two stacked supply areas at 0.99710-0.97460.

Daily TF.
Price appears to be forming a range (a magnified view of the price action on the weekly timeframe) with the highs being seen at 0.90367 and the lows at 0.89081. A break below this range would likely see price testing the S/R flip level just below at 0.88501, conversely, a break above the range would likely see price testing supply at 0.91563-0.90844.
Price closed just below the range on Friday at 0.89072; however, this close was not strong enough consider selling, so we will see what happens today or tomorrow, as we may get a more confirmed break.
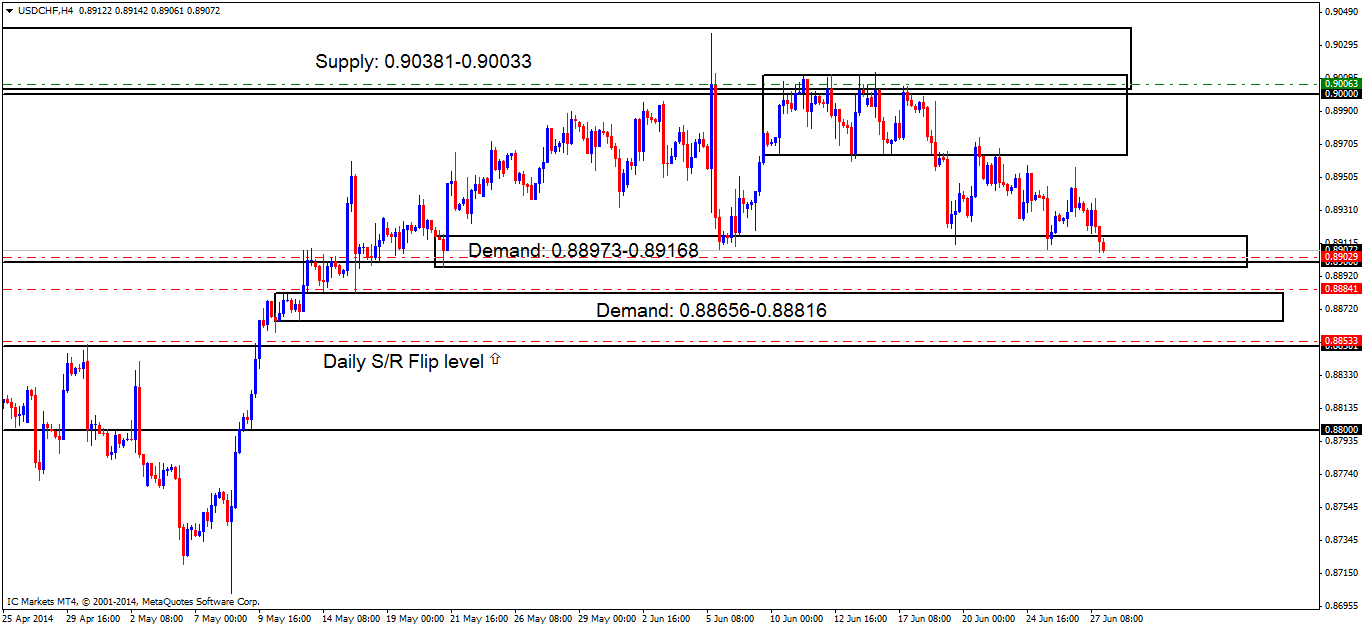
4hr TF.
Price saw a sell off towards the end of last week driving price deep into demand at 0.88973-0.89168, which also has the round number 0.89000 lurking within.
A break below the demand area just mentioned will likely see price testing oncoming demand at 0.88656-0.88816, but for the moment price still remains capped between the low of the mini range above at 0.89643 acting as temporary resistance, and where price is currently trading within (demand: 0.88973-0.89168).
Pending/P.A confirmation orders:
- No pending buy orders (Green line) are seen in the current market environment.
- P.A confirmation buy orders (Red line) are seen just above the daily S/R flip level (0.88501) at 0.88533. This level needs to see some confirming price action before any entry is placed in the market, due to their being no logical area for a stop loss order.
- New P.A confirmation buy orders (Red line) are seen just above demand (0.88656-0.88816) at 0.88841. The reason a P.A confirmation buy order was set here rather than a pending buy order is because this demand area has already seen two touches (look to the far left), meaning some or all of the big buy orders have already been consumed, hence the need for a confirmation buy order.
- Near-term P.A confirmation buy orders (Red line) are seen within demand (0.88973-0.89168) at 0.89029, just above the round number 0.89000, as price may retrace to demand to collect unfilled orders deeper within this area.
- The pending sell order (Green line) visible at the base of supply (0.90381-0.90033) just above the round number 0.90000 at 0.90063 still remains active. The first target has been hit at 0.89168, we have closed most of our final position now, allowing a very small position to run, giving price room to move, and hopefully hit our final target at the daily S/R flip level (0.88501).
- No P.A confirmation sell orders (Red line) are seen in the current market environment.
Quick Recap:
The weekly timeframe is slow with price seen consolidating just above weekly demand at 0.85670-0.88360, while on the daily timeframe we can see the consolidation in more detail with price currently seeing a small close below it. The 4hr timeframe shows price trading deep within demand at 0.88973-0.89168 nearly triggering our P.A confirmation buy order set at 0.89029. It is a very difficult pair to analyze at the moment, but we can be pretty confident the 4hr demand area just mentioned will likely break lower, possibly testing oncoming 4hr demand below at 0.88656-0.88816, and triggering our P.A confirmation buy order at 0.88841.
- Areas to watch for buy orders: P.O: There are no pending buy orders seen in the current market environment. P.A.C: 0.88533 (SL: Dependent on approaching price action after the level has been confirmed TP: Dependent on approaching price action after the level has been confirmed) 0.88841 (SL: likely to be set at 0.88618 TP: Dependent on approaching price action after the level has been confirmed).
- 0.89029 (SL: likely to be set at 0.88784 TP: Dependent on approaching price action after the level has been confirmed).
- Areas to watch for sell orders: P.O: (Active – 1st target hit) 0.90063 (SL: 0.90412 TP: [1] 0.89168[2] 0.88501) P.A.C: There are currently no P.A confirmation sell orders seen in the current market environment).
XAU/USD (GOLD)
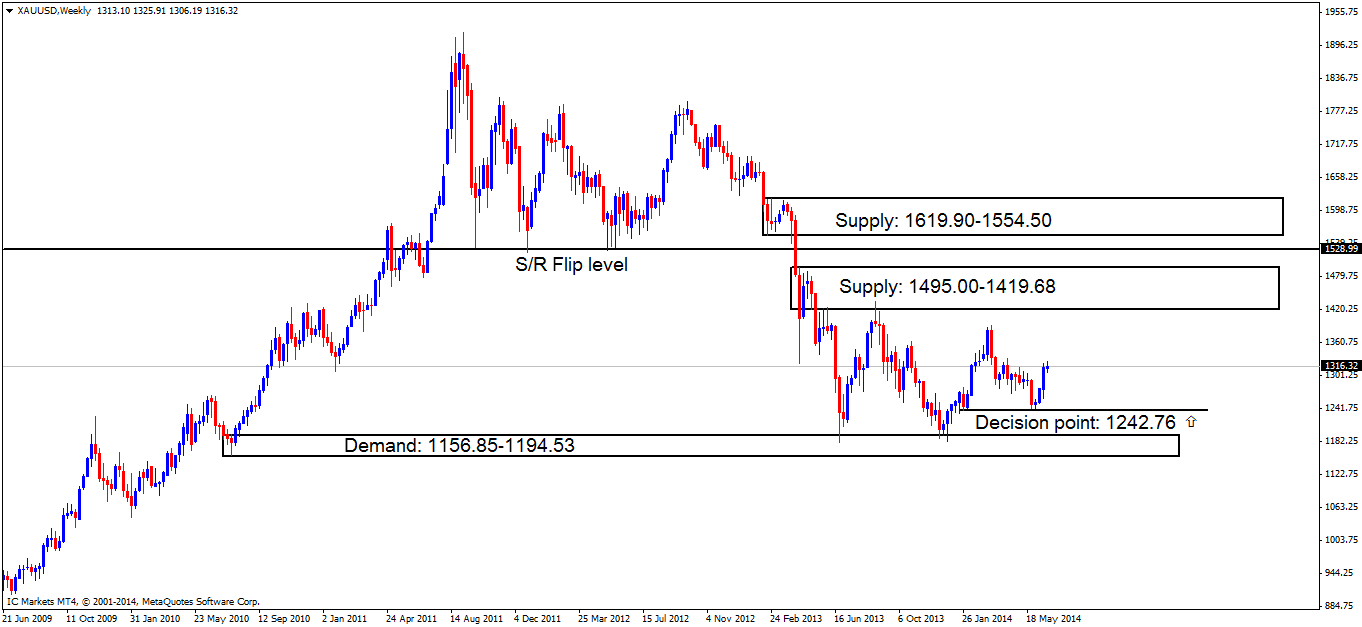
Weekly TF.
Price reacted fantastically off of the weekly decision point area at 1242.76 with sellers not showing much interest at the moment.
Overall, price remains capped between weekly demand below at 1156.85-1194.53 and supply above at 1495.00-1419.68.
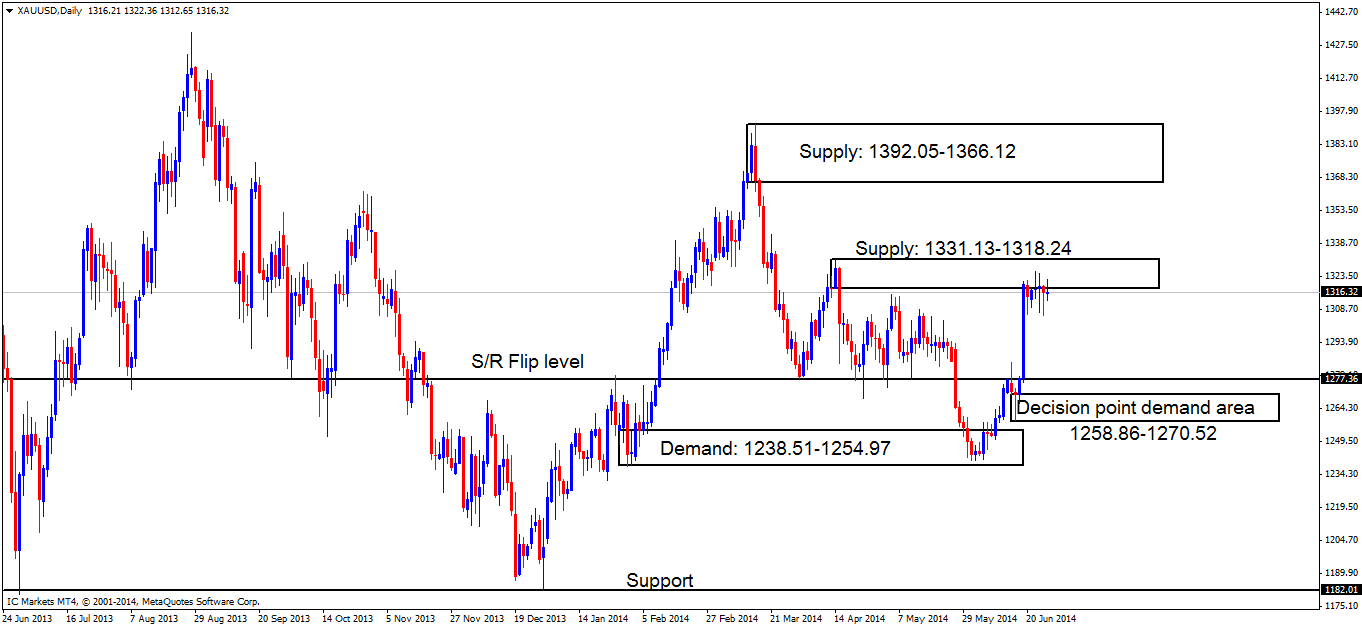
Daily TF.
The daily supply area at 1331.13-1318.24 is creating a right mess! There are wicks and tails going in all direction with either side yet to be taking charge. If price breaks above this supply area, we will likely see oncoming supply at 1392.05-1366.12 being hit, but lower prices will likely be seen before this daily supply area (1331.13-1318.24) is consumed.
4hr TF.
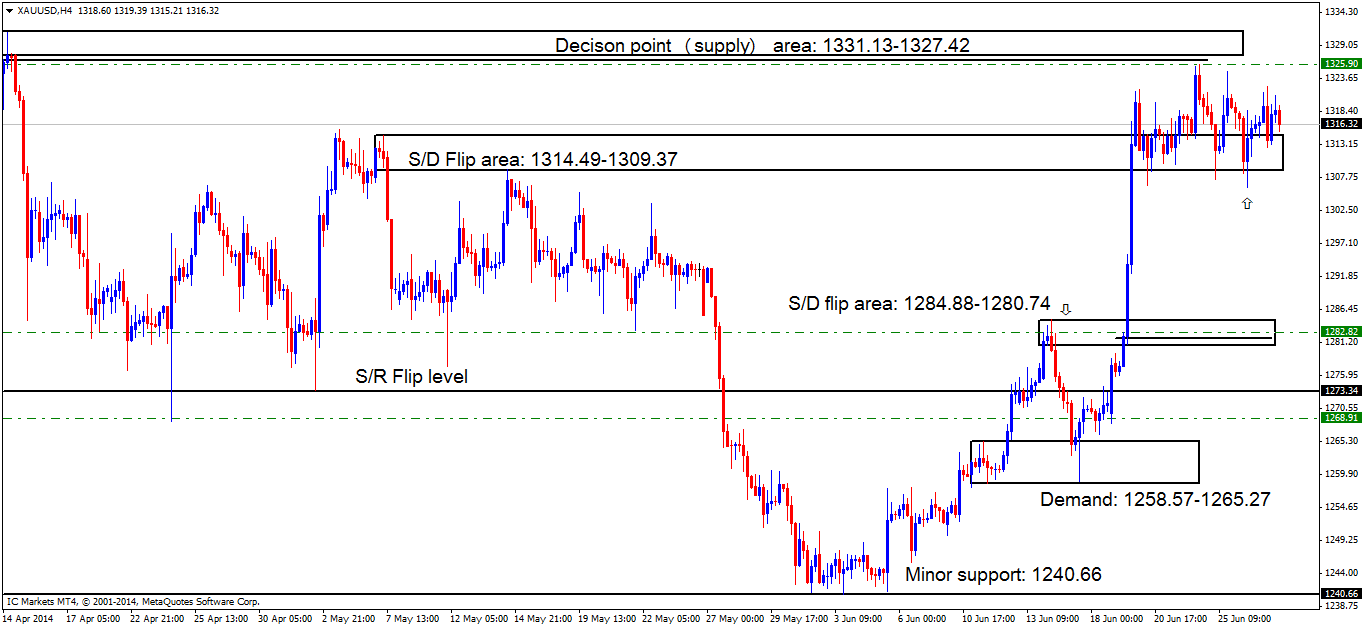
The 4hr timeframe shows how much of a mess price action is on the daily timeframe when magnified. Price has been trading all week in between the decision point (supply) area at 1331.13-1327.42 and demand (S/D flip area) at 1314.49-1309.37.
As price is currently trading in and around daily supply (levels above) we are still favoring lower prices from here. A tail marked with an arrow likely consumed more of the buyers around the 4hr S/D flip area (levels above), thus making a drop lower more possible.
Pending/P.A confirmation orders:
- Pending buy orders (Green line) are seen within demand (S/D flip area… 1284.88-1280.74) at 1282.82. We have set a pending buy order here due to the fact there was a decision made here (marked by the black horizontal level, when decisions are made by pro money, they may be unfilled buy orders left there, hence the fact we have set our pending order there.
- Pending buy orders (Green line) are seen just above demand (1258.57-1265.27) at 1268.91. We are permitted to set a pending buy order here as the buyers have consumed sellers within (which was at the time of writing) supply at 1293.47-1285.52, as per the previous confirmation buy order originally set at 1266.00 (See Thursday 19th June for details).
- No P.A confirmation buy orders (Red line) are seen in the current market environment.
- Pending sell orders (Green line) are seen just below the supply/decision point (1331.13-1327.42) at 1325.90. A pending sell order was set here because this area is deep within daily supply (1331.13-1318.24) and the momentum away from the area indicates unfilled orders may well be left there.
- No P.A confirmation sell orders (Red line) are seen in the current market environment.
Quick Recap:
Price has not changed much at all, and Friday’s analysis still holds strong:
The daily timeframe shows sellers are currently struggling around daily supply at 1331.13-1318.24, while on the 4hr timeframe a decision needs to be made. Price will either have to consume and break supply at 1331.13-1327.42, or consume and break demand below at 1314.49-1309.37.
We however, favor the latter, because we are presently trading in and around in higher-timeframe daily supply (levels above) If this does indeed happen, our pending sell order set at 1325.90 may well be filled as pro money may perform a deeper test of supply above at 1331.13-1327.42 to help fill the liquidity requirements (buy orders to sell into) for the overall sell off.
- Areas to watch for buy orders: P.O: 1268.91 (SL: 1264.30 TP: Dependent on approaching price action) 1282.82 (SL: 1275.12 TP: Dependent on approaching price action). P.A.C: There are currently no P.A confirmation buy orders seen in the current market environment.
- Areas to watch for sell orders: P.O: 1325.90 (SL: 1332.71 TP: Dependent on approaching price action). P.A.C: There are currently no P.A confirmation sell orders seen in the current market environment.
Sources: IC Markets Trading Desk


