
Previous Story
Simplified wave analysis USD / JPY for the week of November 26
Posted On 26 Nov 2018
Comment: 0
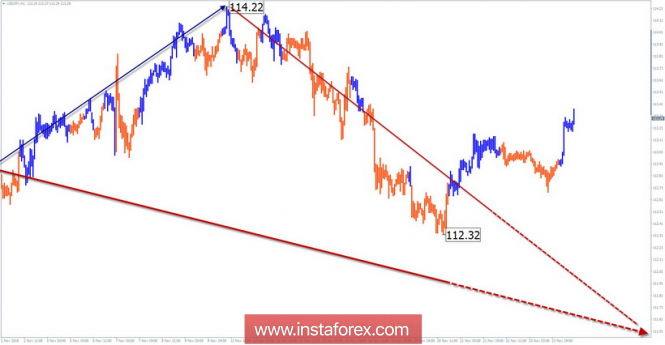
Wave pattern graphics H4:
The still-incomplete downward wave of July 19 corrects a portion of the daily scale trend.
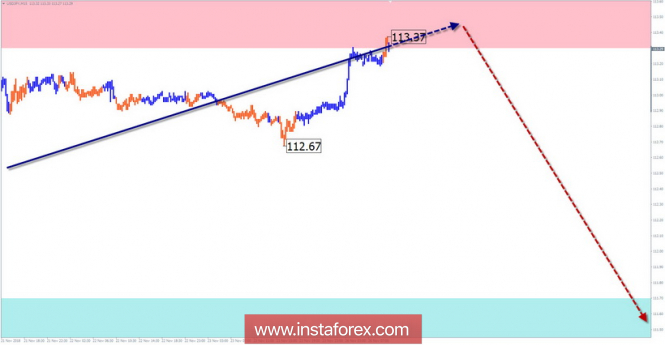
Wave pattern graphics H1:
Beginning on October 3, the descending segment of the chart should complete the correctional wave of the older TF. The wave develops in the lateral plane. In its structure, a clear zigzag can be traced.
Wave pattern graphics M15:
In the bearish construction of November 12, an intermediate pullback was formed. In the wave there is no final part (C).
Recommended trading strategy:
Conditions for shopping in the near future. For short-term trading style advocacy
Resistance zones:
– 113.30 / 113.80
Support areas:
– 111.70 / 111.20
Explanations to the figures: The simplified wave analysis uses waves consisting of 3 parts (A – B – C). For the analysis, 3 main TFs are used. Incomplete wave is analyzed. Zones show calculated areas with the highest probability of reversal.
The arrows indicate the wave marking used by the author. The solid background shows the formed structure, the dotted – the expected movement.
Note: The wave algorithm does not take into account the duration of tool movements over time. To conduct a trade transaction, you need confirmation signals from the trading systems you use!
The material has been provided by InstaForex Company – www.instaforex.com
Source:: Simplified wave analysis USD / JPY for the week of November 26


