Previous Story
STOCKS ARE AT THE END OF THE LINE – PREPARE YOURSELF NOW!
I pay as much attention to anecdotal evidence from the actions of market actors as I do to the actual price action on a daily basis!
Well heres another new all time high for you,
The NYSE margin debt figures were released a few days ago for September last.
NYSE margin debt was up 1.59% on the August figure.
And now stands at a new all time high of $559,641.
Why do I keep mentioning this figure when nobody else bothers evening looking at it?
Well,
There is no better measure to show us how bullish market participants are,
Than to know how much they are risking to participate in the bull run.
Despite new all time highs in the DOW.
The risk embedded in stocks right now is at an extreme that we simply have not witnessed before.
and the result of the unwinding of this debt,
will be unlike anything we have ever witnessed before either!
Also,
The consumer in the U.S, says he is feeling pretty damn great according to the UoM consumer sentiment survey!
That reading has now matched the 2007 highs for the last few months straight.
and we are now sitting at 10 year highs,
Can it go any higher, Yes of course it can,
The real question is this;
Is the consumer predicting future prosperity, or future pain?
The consumer is the ultimate contrarian indicator,
And consumer sentiment tracks the stock market at a high correlation.

I think we will regret this over exuberance bitterly.
TOMORROWS RISK EVENTS:
USD: N/A.
EUR: German Flash Manufacturing PMI, Flash Manufacturing PMI, ECB Monetary Policy Meeting Accounts.
GBP: Second Estimate GDP q/q, Prelim Business Investment q/q.
JPY: N/A.
DOW JONES INDUSTRIALS
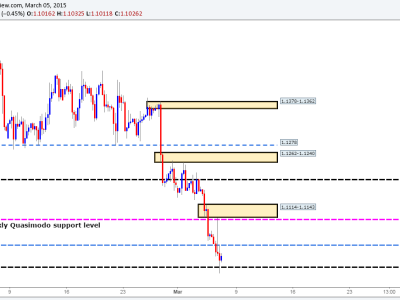
30 min

My Bias: market topping process completing
Wave Structure: Impulsive 5 wave structure, topping in an all time high.
Long term wave count: topping in wave (5)
The recent rally to a new high, altered the structure of wave (iv) to an expanded flat correction.
The break of the recent wave count has opened the possibility that wave (v) will rally to the 24000 region.
This is where wave (v) will reach equality with wave (i) grey.
The new wave count does not change the long term outlook one bit.
This market is closing out its wave structure at at least 6 degrees of trend,
And once the larger structure is complete
The new bear market will begin, have no doubt.
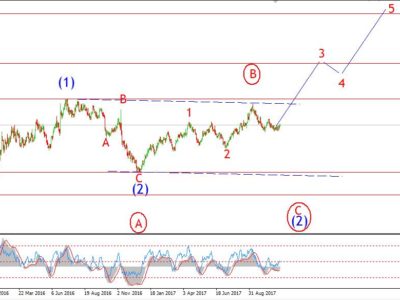
Daily

The DOW corrected today in what should be a temporary setback in wave ‘4’ blue.
wave ‘5’ blue is projected to reach the Fibonacci 161.8% extension of wave ‘1’ at about 23680.
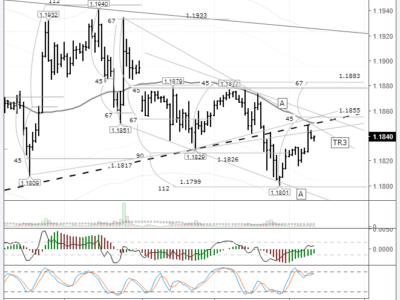
4 Hours

The price is now settling into a series of fourth and fifth waves over the next week to ten days.
For the moment the upper target remains at 23950,
The price must remain above 23491 at the wave ‘i’ high as wave (v) grey closes out.
For Friday;
We should see another rally to a new high to complete wave ‘5’ of ‘iii’.