
Previous Story
Technical analysis for Gold for December 28, 2018
Posted On 28 Dec 2018
Comment: 0
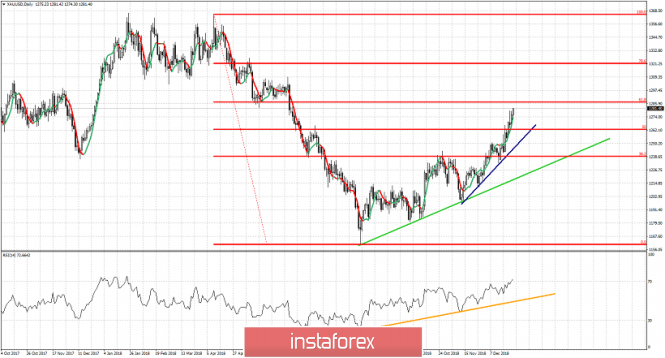
Gold price continues to make higher highs and higher lows. The price is approaching our Fibonacci target of 61.8% of the entire decline, as we mentioned in previous posts. There no warning signs for a major top.
Green line – major trend line support
Blue line – short-term support trend line
Gold line – RSI support trend line
Gold price is approaching our $1,287 target where we find the 61.8% Fibonacci retracement level. This is an important resistance area and I expect to see a pause to this upward trend. The Daily RSI has just entered the overbought levels. There is no bearish divergence. Short-term support and possible pullback area is at $1,260. Resistance is at $1,287-90 and the next one is at $1,308. The trend remains bullish. A break below the blue trend line support would be a bearish sign and something that bulls would not like to see as this would put the bullish scenario and bullish medium-term trend in danger.
The material has been provided by InstaForex Company – www.instaforex.com


