
Previous Story
Technical analysis for Gold for January 11, 2019
Posted On 11 Jan 2019
Comment: 0
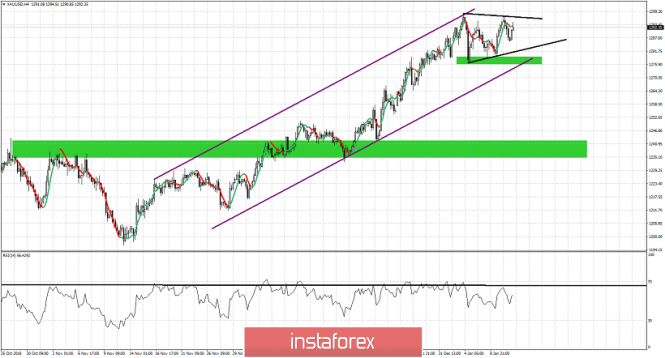
Gold price has not made a new high yet. Price seems to be moving sideways as we are currently in a very short-term correction/consolidation phase before the next upward wave. Price remains inside the bullish channel and above short-term support so trend remains bullish.
Green rectangles – support areas
Purple lines – bullish channel
Black lines – possible triangle pattern
Gold price might be forming a triangle pattern. If this is the case, a break above $1.298 would give me $1,320-25 as the triangle breakout target. We will also need to keep an eye on the RSI to see if we get any bearish divergence signal. So far we continue to consider price to be in a bullish trend, at least as long as we hold above $1,270. Breaking below $1,270 would put the medium-term bullish trend and our $1,350 target in danger.
The material has been provided by InstaForex Company – www.instaforex.com


