
Previous Story
Technical analysis for Gold for January 16, 2019
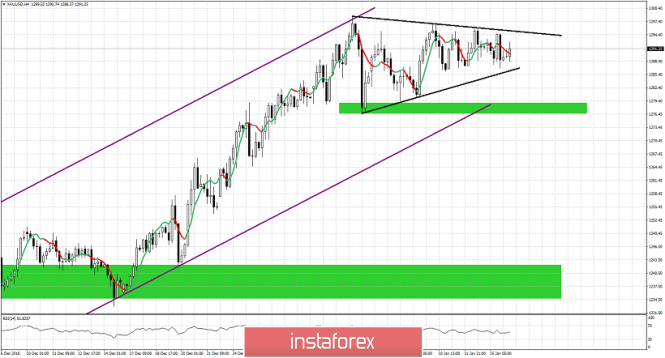
Gold price remains inside the short-term triangle pattern. Medium-term trend remains bullish. If the triangle breaks to the upside we should expect Gold price to reach $1,310-$1,320. This is the most probable scenario. If Gold breaks to the downside we should expect prices to move towards $1,270 or lower.
Green rectangles – support areas
Purple lines – bullish channel
Black lines – triangle pattern
Gold price remains inside the bullish channel and inside the short-term triangle pattern. Resistance is at $1,295.50 and support at $1,286. If $1,286 fails to hold we could see Gold price test the lower channel boundary and maybe the first green rectangle area of support at $1,276-80. For the bullish short-term scenario of $1,310-20 to stay alive, bulls will need to hold above the $1,270-75 area.
The material has been provided by InstaForex Company – www.instaforex.com


