
Previous Story
Technical analysis for Gold for January 23, 2019
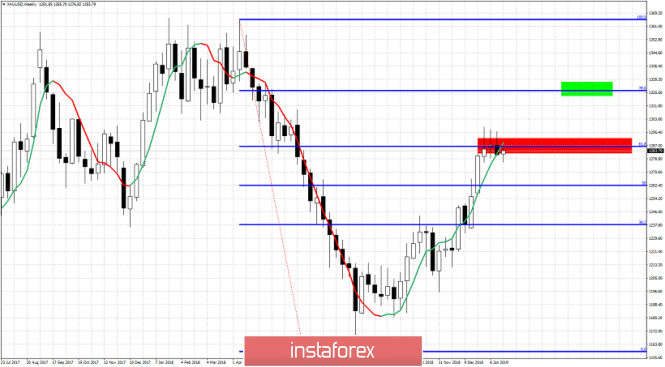
Gold price has been in an up trend since August and has managed to rise from $1,160 to nearly $1,300 where we find an important Fibonacci retracement level. Although technically we remain in a bullish trend and this price pull back is considered corrective in nature, we should not ignore the bearish scenario.
Green rectangle – next target if resistance at $1,300 breaks
Red rectangle – Fibonacci resistance
Gold price has reached the 61.8% Fibonacci retracement level of resistance and got rejected. This is a very important Fibonacci level because around this level we usually see changes in trend. So as long as price remains below the $1,300 resistance area, we remain cautious and the bearish scenario for a deeper pullback remains in play. If price breaks above resistance we should then expect price to reach $1,320. Short-term support is found at $1,270 and any break below it will be a sign of weakness. A move below $1,250-25 will increase the chances of a bigger downtrend in play targeting below $1,160.
The material has been provided by InstaForex Company – www.instaforex.com


