
Previous Story
Technical analysis for Gold for November 26, 2018
Posted On 26 Nov 2018
Comment: 0
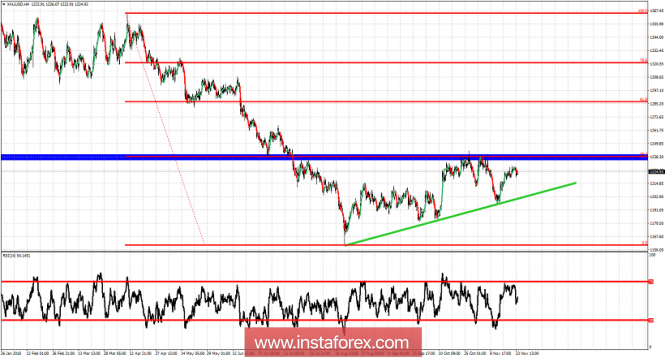
Gold price continues to trade around last week’s highs. Gold continues to trade below the major resistance of $1,243.50 and above $1,220-18 short-term support. Gold price could make a higher high but I prefer to be neutral and look for selling opportunities as long as price is below the October highs.
Blue rectangle – important medium-term resistance area
Green line – trend line support
Gold price has so far topped at the 38% Fibonacci level of the entire decline. A double top has been formed around $1,240-43 and this is a now a confirmed resistance level. This means that a break above this area would be a very bullish sign and could push prices towards the 61.8% Fibonacci level. On the other hand short-term support is at $1,220-18. Breaking below this level will push price towards the important green trend line support. Bulls still have hopes as long as price holds this trend line. If this level is broken, we should expect Gold to challenge August lows.
The material has been provided by InstaForex Company – www.instaforex.com


