Previous Story
Technical analysis of GBP/JPY for December 18, 2017
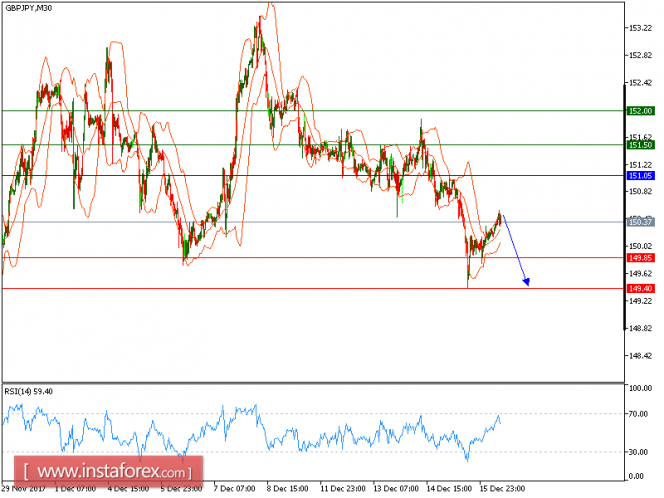
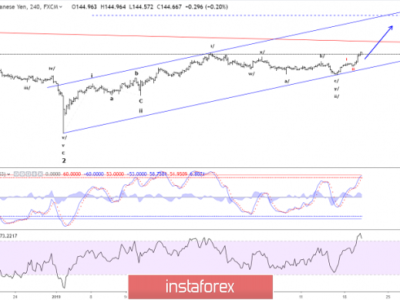
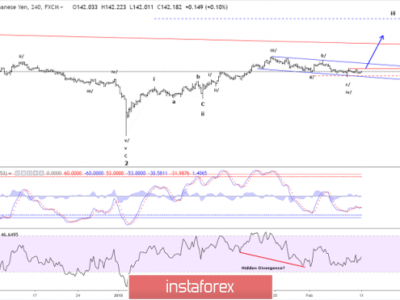
Our first target which we predicted in our previous analysis has been hit. GBP/JPY is still under pressure. The pair retreated from 151.70 and broke below its 20-period and 50-period moving average. The relative strength index is calling for another decline. The upside potential should be limited by the key resistance at 151.05.
To sum up, as long as this key level holds on the upside, a further decline to 149.85 and even to 149.40 seems more likely to occur.
Alternatively, if the price moves in the direction opposite to the forecast, a long position is recommended above 151.05 with the target at 151.50
Strategy: SELL, Stop Loss: 151.05, Take Profit: 149.85
Chart Explanation: the black line shows the pivot point. The price above the pivot point indicates long positions; and when it is below the pivot points, it indicates short positions. The red lines show the support levels and the green line indicates the resistance levels. These levels can be used to enter and exit trades.
Resistance levels: 151.50, 152.00, and 152.55
Support levels: 149.85, 149.40, and 140.40
The material has been provided by InstaForex Company – www.instaforex.com
Source:: Technical analysis of GBP/JPY for December 18, 2017