
Previous Story
Technical analysis of GBP/JPY for February 28, 2018
Posted On 28 Feb 2018
Comment: 0
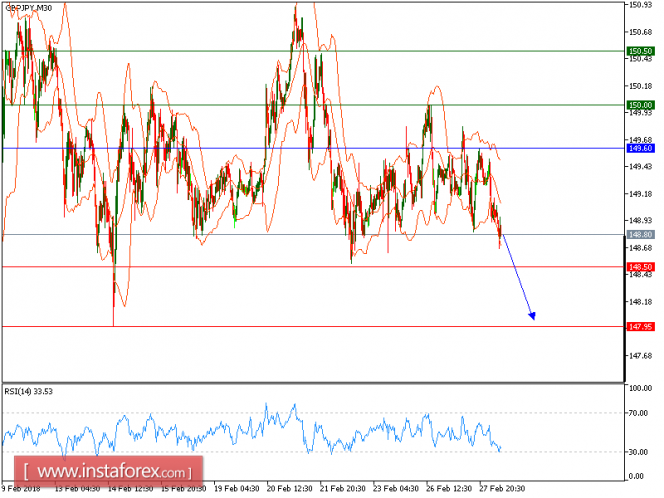
GBP/JPY is under pressure. The pair is clearly turning down, and is also under pressure below its horizontal level at 149.60. A bearish cross has been identified between the 20-period and 50-period moving averages, which should confirm a negative outlook.
In which case, as long as the resistance at 149.60 is not surpassed, the risk of the break below 148.50 remains high.
Alternatively, if the price moves in the direction opposite to the forecast, a long position is recommended to be above 149.60 with the target at 150.00.
Strategy: SELL, Stop loss at 149.60, Take profit at 148.50
Chart Explanation: The black line shows the pivot point. The price above the pivot point indicates long positions; and when it is below the pivot point, it indicates short positions. The red lines show the support levels, and the green line indicates the resistance levels. These levels can be used to enter and exit trades.
Resistance levels: 150.00, 150.50, and 151.00
Support levels: 148.50, 147.95, and 147.50
The material has been provided by InstaForex Company – www.instaforex.com
Source:: Technical analysis of GBP/JPY for February 28, 2018


