
Previous Story
Technical analysis of GBP/JPY for December 05, 2017
Posted On 05 Dec 2017
Comment: 0
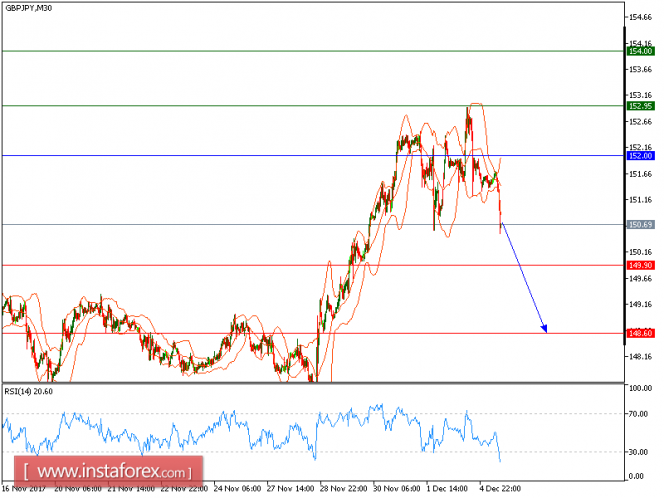
GBP/JPY is expected to trade in a lower range as it is under pressure. The pair is trading sideways within the range between 152 and 148.60, and is likely to test the lower boundary at first. The relative strength index is mixed to bearish below its neutrality area at 50. Last but not least, the 20-period moving average is turning down, confirming a negative outlook.
To sum up, as long as 152.00 is not surpassed, look for a new pullback to 149.90 and 148.60 in extension.
Alternatively, if the price moves in the direction opposite to the forecast, a long position is recommended above 152.00 with the target at 152.95
Strategy: SELL, Stop Loss: 152.00, Take Profit: 149.90
Chart Explanation: the black line shows the pivot point. The price above the pivot point indicates long positions; and when it is below the pivot points, it indicates short positions. The red lines show the support levels and the green line indicates the resistance levels. These levels can be used to enter and exit trades.
Resistance levels: 152.95, 154.00, and 154.60
Support levels: 149.90, 148.60, and 148
The material has been provided by InstaForex Company – www.instaforex.com
Source:: Technical analysis of GBP/JPY for December 05, 2017


