
Previous Story
Technical analysis of GBP/JPY for November 23, 2017
Posted On 23 Nov 2017
Comment: 0
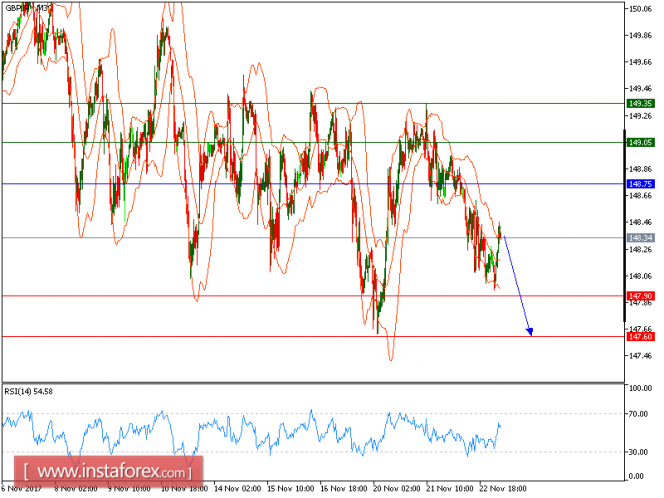
Our first target which we predicted in yesterday’s analysis has been hit. GBP/JPY is expected to trade with a bearish outlook. The pair remains on the downside while being capped by a bearish trend line drawn from November 21. In fact, the descending 20-period moving average is also restricting any further upside potential of the pair. Currently, the pair keeps testing the lower Bollinger band, suggesting possible acceleration to the downside.
A break below the immediate support at 147.90 would trigger a further drop toward 147.60. Key resistance is located at 148.75.
Alternatively, if the price moves in the direction opposite to the forecast, a long position is recommended above 148.75 with the target at 149.05.
Strategy: SELL, Stop Loss: 148.75, Take Profit: 147.90
Chart Explanation: the black line shows the pivot point. The price above the pivot point indicates long positions; and when it is below the pivot points, it indicates short positions. The red lines show the support levels and the green line indicates the resistance levels. These levels can be used to enter and exit trades.
Resistance levels: 149.05, 149.35, and 149.90
Support levels: 147.90, 147.60, and 147
The material has been provided by InstaForex Company – www.instaforex.com
Source:: Technical analysis of GBP/JPY for November 23, 2017


