
Previous Story
Technical analysis of gold for December 13, 2017
Posted On 13 Dec 2017
Comment: 0
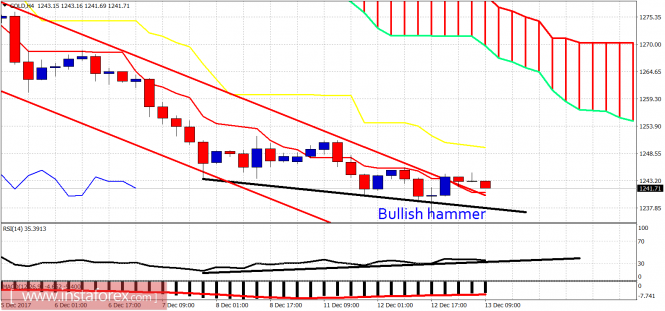
Gold price remains in a bearish trend but yesterday we observed the bullish divergence in the RSI together with a candlestick reversal pattern. Price has the potential to rise to $1,260 today.
Red lines – bearish channel
Black lines – bullish divergence
Gold price has broken out of the bearish channel and is now back testing it. The RSI is warning bears that the downside momentum has weakened. The 4-hour candle pattern of a bullish hammer is usually a trustworthy reversal pattern. Resistance is at $1,247. Breaking above it will confirm the reversal pattern and push price towards cloud resistance at $1,255-60.
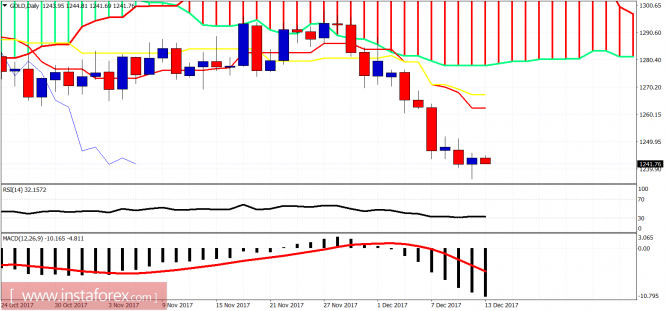
On a daily basis Gold price has also made a bullish hammer. With FOMC tonight we expect Gold price to be volatile. If price is near $1,260 before the FOMC, I would prefer to be neutral as we might see another leg down towards $1,220-$1,200.
The material has been provided by InstaForex Company – www.instaforex.com


