
Previous Story
Technical analysis of gold for July 25, 2017
Posted On 25 Jul 2017
Comment: 0
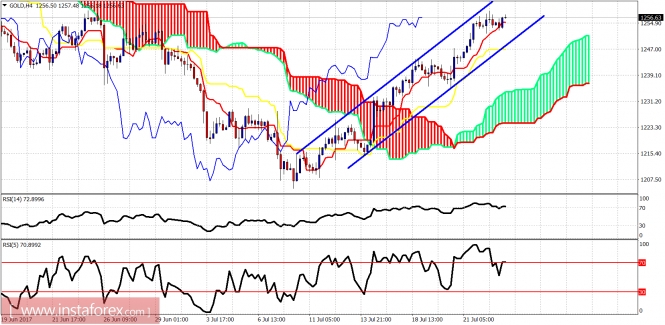
The Gold price is consolidating near its highs. It is very possible that we might see a move above $1,260 soon for a final new high of this move that started at $1,205. Gold bulls must be very cautious as a pull back is justified from current levels.
Blue lines – bullish channel
The Gold price is inside the bullish channel and above both the tenkan- and kijun-sen in the 4-hour chart as shown above. The trend is clearly bullish as the price is making higher highs and higher lows. There is no trend reversal signal, only warnings that this short-term trend might end soon. Support is at $1,247. Resistance is at $1,264.
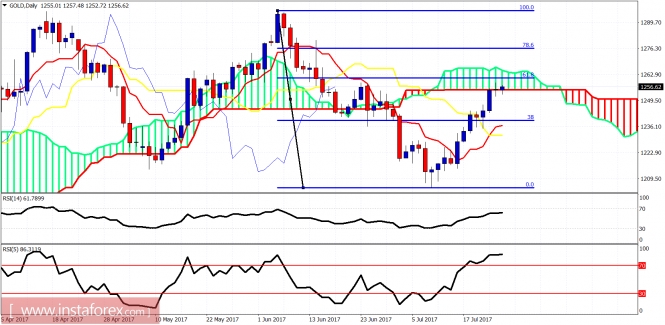
On a daily basis, the Gold price is approaching the 61.8% Fibonacci retracement and the daily Kumo (cloud) resistance. Daily support is at $1,236-30. Resistance zone is found at $1,257-63.The material has been provided by InstaForex Company – www.instaforex.com


